1. Introduction
The problem. A PyTorch training job runs slower than it should, and you want to know which part of your code is responsible. Kernel and CUDA API timelines alone do not provide that attribution; tools such as nsys can add PyTorch operator context through NVTX ranges.
The tool. torch.profiler integrates PyTorch operator attribution, optional source stacks, and CUDA activity in one trace. That integration has a price: the profiler runs inside the PyTorch process, so you must be able to change or configure the program.
The question. How far can torch.profiler alone take a real performance problem, from the first symptom in the trace to a measured fix, and where does it stop?
A short capture can hide the dominant input bottleneck. Smaller host stalls affect throughput only when they exhaust queued GPU work, so reducing visible stall time is not the same as improving training throughput.
What we show.
- The setup and its output (Sections 3–6). We profile ResNet-50 training on Food-101 on a B300 GPU. Each option is explained with the numbers it produces: the step schedule,
record_functionlabels, shape and memory recording, the summary table and the trace. Three effects shape every reading that follows: CPU time is mostly launch time, host reads of GPU values insert syncs, and backward runs on its own thread. - A debugging session (Sections 7–9). A 5 ms idle gap on the GPU leads, through longer traces with Python stacks, to two problems in an input pipeline running at 50% of the input-free reference throughput. We compare input configurations, check each with the profiler, and reach an effective tie near 97–98% with the standard
DataLoaderand NVIDIA DALI. - Where it stops. The trace shows threads freezing and CUDA calls blocking together, but not the lock or driver wait behind them. That is the point to move to nsys.
2. How torch.profiler collects data
2.1 Why operators are called aten::
ATen (“A Tensor Library”) is PyTorch’s C++ tensor library, and aten is the namespace its operators are registered under. Every tensor operation in Python, such as torch.matmul, x + y or F.conv2d, ends up as a call to an aten:: operator. The dispatcher then picks the implementation for the tensor’s device and dtype: a cuDNN convolution on CUDA, a oneDNN one on CPU, and so on.
Operators also call other operators. aten::conv2d calls aten::convolution, which calls aten::cudnn_convolution, and only the last one launches kernels. The profiler records each of these calls, so the trace shows them nested, and the summary table has a row for each. Operators from other namespaces, such as torchvision:: or c10d:: for collectives, go through the same dispatcher and are recorded the same way.
2.2 What the profiler records
- Host side. PyTorch’s dispatcher records every
aten::operator call with its start and end time on the CPU. User code can add named ranges withrecord_function. - Device side. Kineto, PyTorch’s profiling library, uses NVIDIA’s CUPTI to record each kernel and memory copy on the GPU, with GPU timestamps [1, 3].
- Correlation. Kineto links each kernel to the CUDA launch call that issued it, and that launch to the operator that was running at the time. That link is what lets the trace show “this GEMM kernel came from this
nn.Linear”.
2.3 What changes when the profiler is on
Without the profiler, an operator call goes from Python through the dispatcher to a kernel launch, and nothing is written down. With the profiler on, a few hooks are added along that path:
- Around every operator. The dispatcher calls a profiler callback when an operator starts and again when it ends. The callback stores the name, the thread and two CPU timestamps. With
record_shapes=Trueit also stores the input shapes, and withwith_stack=Truethe Python stack at that point. - At every CUDA call. CUPTI intercepts CUDA runtime calls such as
cudaLaunchKernelandcudaMemcpyAsync, and gives each one a correlation ID. Kineto tags it with the ID of the operator that is running, which becomes theExternal idin the trace. - On the GPU. CUPTI records the start and end of each kernel and copy into buffers in host memory. The GPU work itself runs as before.
- In the allocator. With
profile_memory=True, PyTorch’s caching allocator reports each allocation and free. - At stop. The profiler syncs the device, flushes the CUPTI buffers, and matches GPU records to launches by correlation ID. Only then are the summary table and the trace built.
The kernels are the same, but the CPU side is not. Each operator and each CUDA call costs a little extra time on the thread that issued it, and with_stack=True costs much more (Section 5). For that reason, measure throughput in a separate run without the profiler, as Section 9 does.
torch.profiler records activity in the profiled process. CUDA activity from other libraries can appear, but may lack PyTorch operator attribution. It does not provide a system-wide view of other processes or explain what happens inside a kernel.
3. A minimal example
The training loop below is small, but it uses every piece a larger setup needs: a set of activities, a step schedule, prof.step() once per iteration, and named regions.
3.1 Imports
import torch
import torch.nn as nn
from torch.profiler import ProfilerActivity, profile, record_function, schedule

device = "cuda" if torch.cuda.is_available() else "cpu"
The whole post uses one workload: ResNet-50 [4] trained on Food-101, which is large enough to keep the GPU busy.
3.2 Data: Food-101
import os
from torch.utils.data import DataLoader
from torchvision import datasets, models, transforms

# Food-101: 75,750 training images, 101 classes.
food_tf = transforms.Compose([
    transforms.RandomResizedCrop(224),
    transforms.RandomHorizontalFlip(),
    transforms.ToTensor(),
    transforms.Normalize([0.485, 0.456, 0.406], [0.229, 0.224, 0.225]),
])
food_train = datasets.Food101(root="data", split="train", transform=food_tf, download=True)
food_loader = DataLoader(
    food_train,
    batch_size=128,
    shuffle=True,
    num_workers=min(8, os.cpu_count()),
    pin_memory=True,
    persistent_workers=True,
)
This loads the Food-101 training split and applies standard ImageNet augmentation: a random 224×224 crop, a horizontal flip, and normalisation with the ImageNet mean and standard deviation. The DataLoader decodes and augments images in 8 worker processes and groups them into batches of 128, giving 592 batches per epoch. pin_memory=True places each batch in page-locked host memory, so the copy to the GPU can run asynchronously. persistent_workers=True keeps the workers alive between calls to iter(food_loader), so worker start-up does not show up in the profile.
3.3 Model and training loop: ResNet-50
# ResNet-50 from scratch, 23.7M parameters.
model = models.resnet50(weights=None, num_classes=101).to(device, memory_format=torch.channels_last)
loss_fn = nn.CrossEntropyLoss()
optimizer = torch.optim.SGD(model.parameters(), lr=0.1, momentum=0.9)

def train_step(steps: int, prof=None):
    model.train()
    batches = iter(food_loader)
    losses = []
    for _ in range(steps):
        with record_function("data_load"):
            images, labels = next(batches)
        with record_function("h2d_copy"):
            images = images.to(device, non_blocking=True, memory_format=torch.channels_last)
            labels = labels.to(device, non_blocking=True)
        with record_function("forward"):
            logits = model(images)
        with record_function("loss_calc"):
            loss = loss_fn(logits, labels)

        optimizer.zero_grad(set_to_none=True)

        with record_function("backprop"):
            loss.backward()
        with record_function("optimize_step"):
            optimizer.step()

        if prof is not None:
            prof.step()
        losses.append(loss.detach())
    return torch.stack(losses).cpu()
models.resnet50(weights=None, num_classes=101)builds ResNet-50 with random weights and a 101-way classifier.channels_laststores activations in NHWC layout. cuDNN’s fastest convolution and batch-norm kernels on recent GPUs use this layout, which is why the kernel names in the table below containnhwc.train_stepruns one training iteration per batch and wraps each phase in arecord_functionlabel:data_load,h2d_copy,forward,loss_calc,backpropandoptimize_step.non_blocking=Truelets the host-to-device copy run asynchronously from the pinned buffer.prof.step()marks the end of each iteration for the profiler’s schedule.- The loss stays on the GPU (
detach()) and is copied to the host only once, after the loop, so no host sync happens inside the profiled steps.
3.4 Running the profiler
activities = [ProfilerActivity.CPU] + ([ProfilerActivity.CUDA] if device == "cuda" else [])
sort_key = "self_device_time_total" if device == "cuda" else "self_cpu_time_total"

train_step(3)  # warm up workers, cuDNN autotuning and the allocator outside the profiler

wait, warmup, active = 1, 2, 5
with profile(
    activities=activities,
    schedule=schedule(wait=wait, warmup=warmup, active=active, repeat=1),
    record_shapes=True,
    profile_memory=True,
) as prof:
    train_step(wait + warmup + active, prof=prof)

print(prof.key_averages().table(sort_by=sort_key, row_limit=20))
Three steps run first, outside the profiler. They start the data-loader workers, let cuDNN pick its kernels, and grow the caching allocator to its working size. The profiled run then takes 1 + 2 + 5 = 8 steps: one is skipped, two warm up the profiler, and five are recorded. The summary table merges the events from those 5 steps by name and prints the 20 rows with the most GPU self time.
3.5 What each part does
activities.CPUrecords host-side operators and therecord_functionranges.CUDAadds the GPU kernels and memory copies through CUPTI.- On a machine without a GPU the example still runs, but it records CPU work only.
record_function("forward")and the other labels.- Each label opens a named range on the CPU timeline. Every
aten::operator called inside it becomes a child, for exampleaten::conv2d→aten::convolution→aten::cudnn_convolutionfor each convolution layer. - Without these labels, the trace still has the operators, but you have to work out yourself which phase of the step they belong to.
- Each label opens a named range on the CPU timeline. Every
schedule(wait=1, warmup=2, active=5, repeat=1). The profiler moves through these states, one step at a time:- wait (1 step): nothing is recorded.
- warmup (2 steps): the profiler is running, but the results are thrown away. This keeps the profiler’s own start-up cost out of the data. One-time costs of the program, such as cuDNN autotuning and allocator growth, are already handled by the
train_step(3)call before the profiler starts. - active (5 steps): recorded.
repeat=1means one cycle only. Withrepeat=0, the cycle repeats until the profiler exits.
prof.step(). This marks the end of an iteration, and the schedule counts steps only through it. If you forget it, the profiler stays inwaitand records nothing.record_shapes=True. Stores input shapes per operator. Withkey_averages(group_by_input_shape=True)you can then tell, for example, a convolution on a 56×56 feature map apart from the same operator on a 7×7 one.profile_memory=True. Records each allocation and free in PyTorch’s caching allocator. The table then shows memory columns (Self CUDA Mem) per operator.key_averages().table(sort_by=..., row_limit=20).- Merges all calls of the same operator or label across the active steps, then prints the top 20 rows.
- Sorting by
self_device_time_totalranks by GPU time spent in the operator itself, without its children. On CPU,self_cpu_time_totalplays the same role.
export_chrome_trace(path). Writes the full timeline as JSON. Open it in Perfetto (https://ui.perfetto.dev) orchrome://tracing.
3.6 Reading the summary table
Name                                         Self CPU  CPU total  Self CUDA  Self CUDA %  Self CUDA Mem  Calls
-------------------------------------------  --------  ---------  ---------  -----------  -------------  -----
forward                                       0.000us    0.000us   53.091ms       34.63%            0 B      5
aten::convolution_backward                    9.714ms   13.335ms   33.102ms       21.59%       25.11 GB    265
aten::cudnn_batch_norm_backward               3.815ms    9.156ms   24.642ms       16.07%     -596.39 MB    265
cudnn::batchnorm_bwtr_nhwc_semiPersist<...>   0.000us    0.000us   21.424ms       13.97%            0 B    150
aten::cudnn_batch_norm                        9.496ms   21.075ms   20.657ms       13.47%     -856.56 MB    265
aten::cudnn_convolution                      13.522ms   15.845ms   15.400ms       10.04%       26.54 GB    265
aten::add_                                    4.080ms    6.554ms   12.231ms        7.98%            0 B    425
aten::threshold_backward                      1.600ms    2.686ms   10.380ms        6.77%       22.95 GB    245
h2d_copy                                      0.000us    0.000us    8.944ms        5.83%            0 B      5
aten::copy_                                 334.018us    1.466ms    8.922ms        5.82%     -370.00 MB     25
Memcpy HtoD (Pinned -> Device)                0.000us    0.000us    8.629ms        5.63%            0 B     10
...
Self CPU time total: 240.493ms
Self CUDA time total: 153.329ms
Trimmed from the printed table, which has 20 rows and more columns: the %, average and CPU memory columns.
How to read it (all numbers cover the 5 active steps):
- Columns. “Self” means the row’s own work, without the operators it calls. “Total” includes them.
Name: arecord_functionlabel, anaten::operator, or a GPU kernel.Self CPU: host time spent in the row itself.CPU total: host time including all child operators.Self CUDA: GPU time of the kernels this row launched directly.Self CUDA %:Self CUDAas a share ofSelf CUDA time total, shown at the bottom of the table.Self CUDA Mem: GPU memory the row allocated minus what it freed, without its children. It can be negative.Calls: how many times the row ran in the active steps.
- Three kinds of rows.
forwardandh2d_copyarerecord_functionlabels.aten::*rows are operators.cudnn::batchnorm_bwtr_nhwc_semiPersist<...>is a GPU kernel, andMemcpy HtoD (Pinned -> Device)is a copy on the GPU.- A kernel’s time is counted in its own row, again in the operator that launched it, and a third time in the label around it. That is why the
Self CUDA %column adds up to well over 100%.
- Labels show a GPU span, not GPU work.
forwardreports 53.1 ms ofSelf CUDAand no CPU time. For a label, the profiler measures from the start of the first kernel launched inside it to the end of the last one, so the figure includes any idle time on the GPU in between. The kernels themselves run for 10.3 ms per step, 51.5 ms in total (Section 4). In this table the label rows show only the GPU side. Read their CPU time from the operators under them, or from the trace. - Calls tell you where an operator comes from.
aten::cudnn_convolutionandaten::cudnn_batch_normhave 265 calls each: ResNet-50’s 53 convolution and 53 batch-norm layers, times 5 steps.aten::threshold_backwardhas 245 calls: the 49 ReLU calls per step, times 5.- The kernel
cudnn::batchnorm_bwtr_nhwc_semiPersisthas 150 calls, not 265. cuDNN picks the kernel by layer shape, so the other batch-norm backward calls use other kernels further down the table.
- CPU time vs GPU time.
aten::cudnn_convolutionspends 13.5 ms on the CPU and 15.4 ms on the GPU.aten::convolution_backwardspends 9.7 ms on the CPU and 33.1 ms on the GPU.aten::copy_spends 0.33 ms on the CPU and 8.9 ms on the GPU, because the copy from pinned memory runs asynchronously.- Kernel rows have no CPU time at all, because they run only on the GPU.
- Memory.
Self CUDA Memadds up every allocation minus every free over the 5 steps; it is not a peak.aten::cudnn_convolutionallocates 26.5 GB, about 100 MB per call: the layer outputs, which are kept for backward.aten::cudnn_batch_norm_backwardfrees more than it allocates, so its value is negative. Figure 5 shows the memory actually in use over time. - Totals.
Self CPU time totalis 240.5 ms andSelf CUDA time totalis 153.3 ms, over five steps of 28–44 ms each. The CPU total adds up the main thread and the autograd thread, which run at the same time, so it is not wall time. Section 4 compares the two sides step by step.
3.7 Exporting and reading the trace
prof.export_chrome_trace("trace.json")
The file is a JSON list of traceEvents. One ResNet-50 step has thousands of events. The seven below are from ProfilerStep#4 and follow the first convolution of the model (conv1) from its label to its kernel, plus one backward operator and one allocation. Fields that do not matter here are trimmed.
// [E1] label from record_function
{"ph": "X", "cat": "user_annotation", "name": "forward",
 "pid": 3663150, "tid": 3663150, "ts": 669899193162.801, "dur": 15083.913,
 "args": {"External id": 29657}}

// [E2] operator on the main thread
{"ph": "X", "cat": "cpu_op", "name": "aten::cudnn_convolution",
 "pid": 3663150, "tid": 3663150, "ts": 669899193247.214, "dur": 120.501,
 "args": {"External id": 29661,
          "Input Dims": [[128, 3, 224, 224], [64, 3, 7, 7], [], [], [], [], [], [], []],
          "Input Strides": [[150528, 1, 672, 3], [147, 1, 21, 3], [], [], [], [], [], [], []]}}

// [E3] CUDA launch issued by E2 (the third of three)
{"ph": "X", "cat": "cuda_runtime", "name": "cudaLaunchKernelExC",
 "pid": 3663150, "tid": 3663150, "ts": 669899193349.344, "dur": 9.329,
 "args": {"External id": 29661, "correlation": 326650}}

// [E4] GPU kernel started by E3
{"ph": "X", "cat": "kernel",
 "name": "sm80_xmma_fprop_implicit_gemm_indexed_wo_smem_tf32f32_tf32f32_f32_nhwckrsc_nhwc_tilesize128x32x16_stage1_warpsize4x1x1_g1_tensor16x8x8_aligna4_alignc8_execute_kernel__5x_cudnn",
 "pid": 0, "tid": 7, "ts": 669899208508.115, "dur": 549.827,
 "args": {"External id": 29661, "correlation": 326650, "stream": 7,
          "grid": [2, 12544, 1], "block": [128, 1, 1], "est. achieved occupancy %": 25}}

// [E5] flow arrow from E3 to E4 (GPU end)
{"ph": "f", "cat": "ac2g", "name": "ac2g", "id": 326650,
 "pid": 0, "tid": 7, "ts": 669899208508.115, "bp": "e"}

// [E6] backward operator on the autograd thread
{"ph": "X", "cat": "cpu_op", "name": "autograd::engine::evaluate_function: NllLossBackward0",
 "pid": 3663150, "tid": 3663546, "ts": 669899209279.704, "dur": 109.613}

// [E7] one allocation
{"ph": "i", "cat": "cpu_instant_event", "name": "[memory]",
 "pid": 3663150, "tid": 3663546, "ts": 669899209311.12,
 "args": {"Bytes": 51712, "Total Allocated": 11280282112, "Total Reserved": 13350469632}}
The // [E1]–// [E7] labels are added here for reference; the exported file has no comments.
How to read them:
phis the event type."X"is a span with starttsand durationdur, both in microseconds (E1–E4, E6)."i"is an instant event (E7), and"f"is one end of a flow arrow (E5).
pid/tidplace the event on a row.- Host events use the OS process and thread IDs: E1–E3 are on the main thread
3663150. - On Linux, the main thread’s ID equals the process ID, so the row where
tidequalspidis the main thread, which runs the Python training loop. Other threads of the same process share thepidbut have their owntid, such as the autograd thread3663546(E6, E7). - GPU events use
pid= device andtid= CUDA stream: E4 and E5 are on device0, stream7.
- Host events use the OS process and thread IDs: E1–E3 are on the main thread
- Linking a kernel to its operator.
External id: 29661appears in E2, E3 and E4. It ties theaten::cudnn_convolutionoperator to the launch call and the kernel it caused.correlation: 326650appears in E3 and E4. It ties the CUDA launch to the GPU kernel.- E5, the
ac2gflow event withid: 326650, is the GPU end of that arrow in Perfetto. A matching"ph": "s"event on the main thread at E3’stsis the CPU end. - E1 has its own
External id(29657). Its link to E2 comes from the time range: E2 starts and ends inside E1 on the same thread.
- One operator, several kernels. E2 makes three launches with the same
External id. The first two (correlations 326642 and 326646) start cuDNNconvertTensorkernels of 42 µs and 4 µs; E3 starts the convolution kernel itself. Filtering the trace on oneExternal idgives everything an operator ran on the GPU. - CPU and GPU time differ. On the CPU, E2 takes 121 µs. The kernel it launched (E4) runs for 550 µs on the GPU.
- Launch and execution are far apart. E4 starts 15.2 ms after E3 launched it, after E1 has already ended. The CPU is that far ahead of the GPU, still queuing work while the GPU finishes the previous step (Section 4).
- Shapes.
Input DimsandInput Stridesin E2 come fromrecord_shapes=True. The input is[128, 3, 224, 224]and the weight[64, 3, 7, 7]. The strides[150528, 1, 672, 3]show the input is stored channels-last, which matchesnhwcin the kernel name. - Launch shape. In E4,
gridandblockare the kernel’s launch configuration (25,088 blocks of 128 threads), andest. achieved occupancy %is the profiler’s estimate of active warps as a share of each SM’s maximum. Here it is 25%, limited by registers (122 per thread). It is an estimate, not a measured value. - Backward runs on its own thread.
NllLossBackward0(E6) runs ontid 3663546, not the main thread3663150. In this step, 1,585 of the 2,538cpu_opevents are on that autograd thread. - Memory events.
[memory]events such as E7 come fromprofile_memory=True. Each one records a single allocation or free (here 51,712 bytes), together with the running allocator totals: 10.5 GiB allocated and 12.4 GiB reserved at this point, near the peak of Figure 5.
3.8 Plots from the trace
The figures below are drawn from the ResNet-50 trace of the run in Section 3.4, covering the 5 active steps.
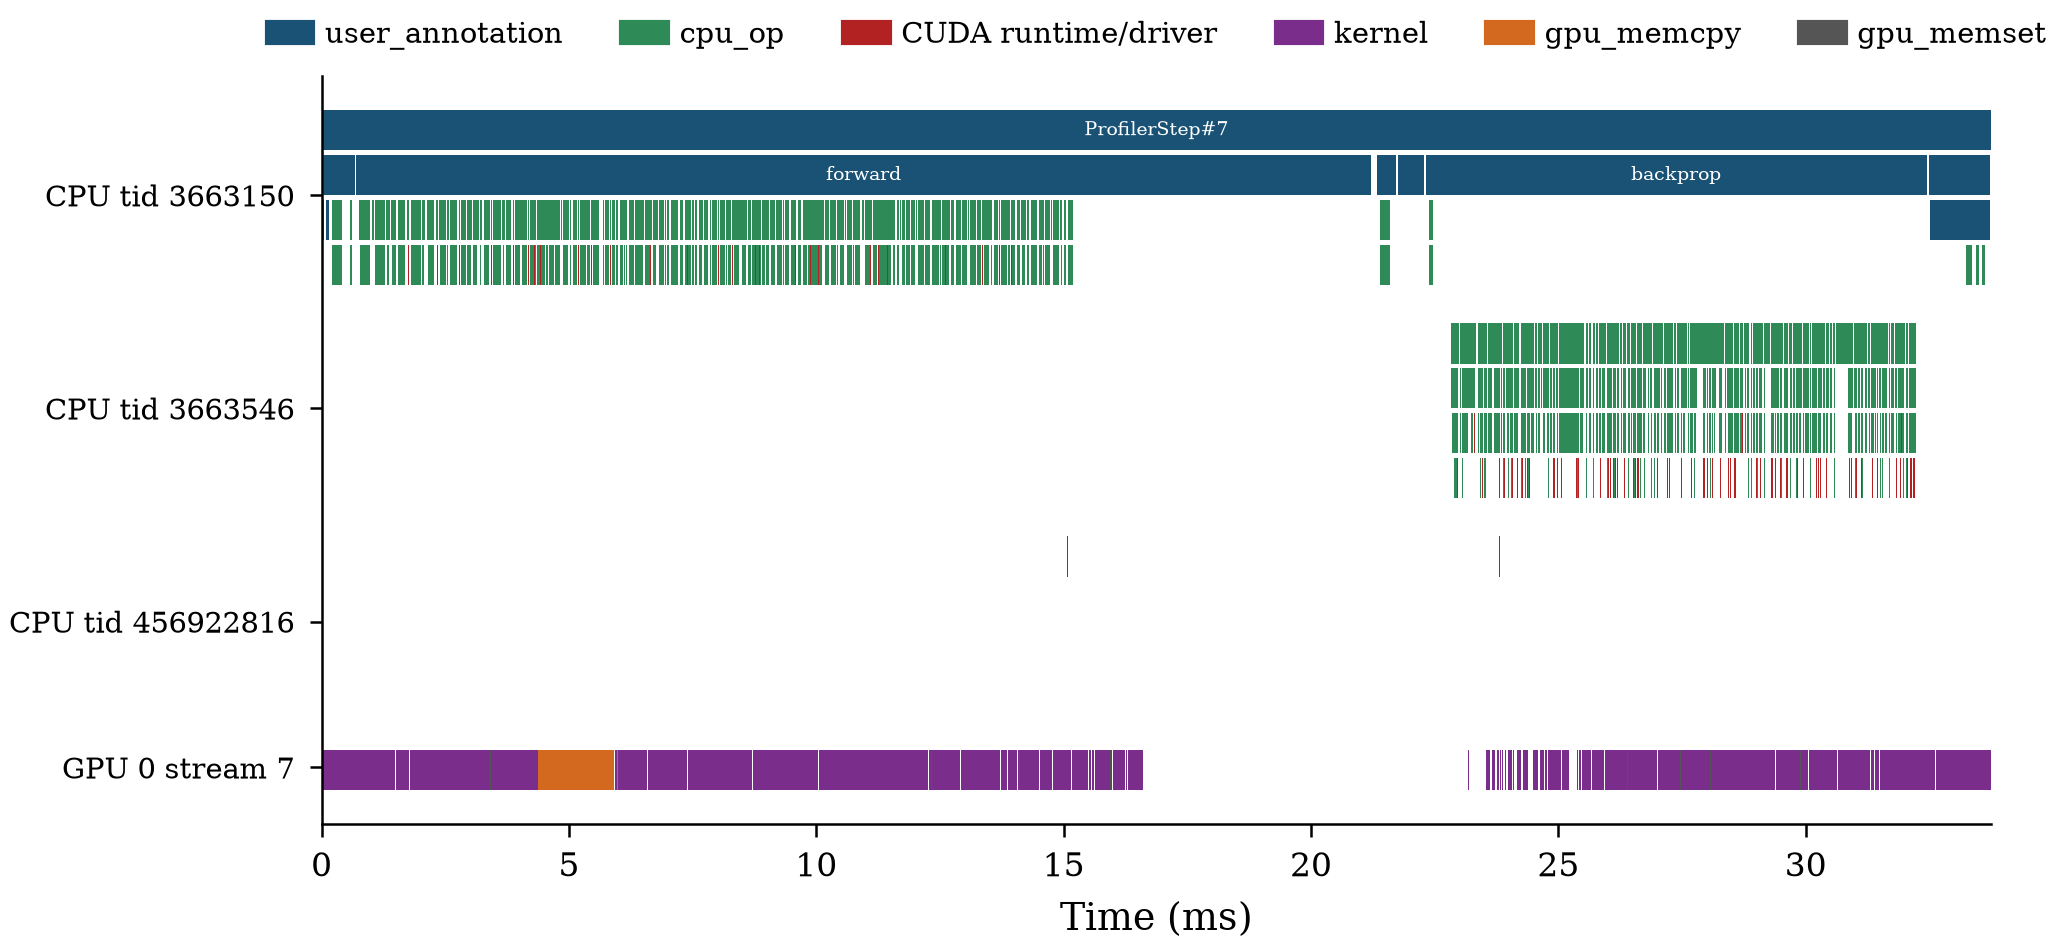
Figure 1. One profiled step (ProfilerStep#7). From top to bottom: the main CPU thread with the forward and backprop labels and the operators under them, the autograd thread that runs backward, and the GPU stream. The orange block on the GPU is the host-to-device copy of the batch.
- The GPU stream stays full while the main thread works through
forward, but for most of that time it is still running the previous step’s backward. The CPU is ahead of the GPU (Section 4). - As in E6 of Section 3.7, the backward operators run on a separate thread (tid 3663546), not under
backpropon the main thread. - From 16.6 ms to 21.5 ms the GPU has nothing to run. This gap lowers GPU utilization in the last two steps of Figure 2. Section 7 tracks it down using only the profiler.
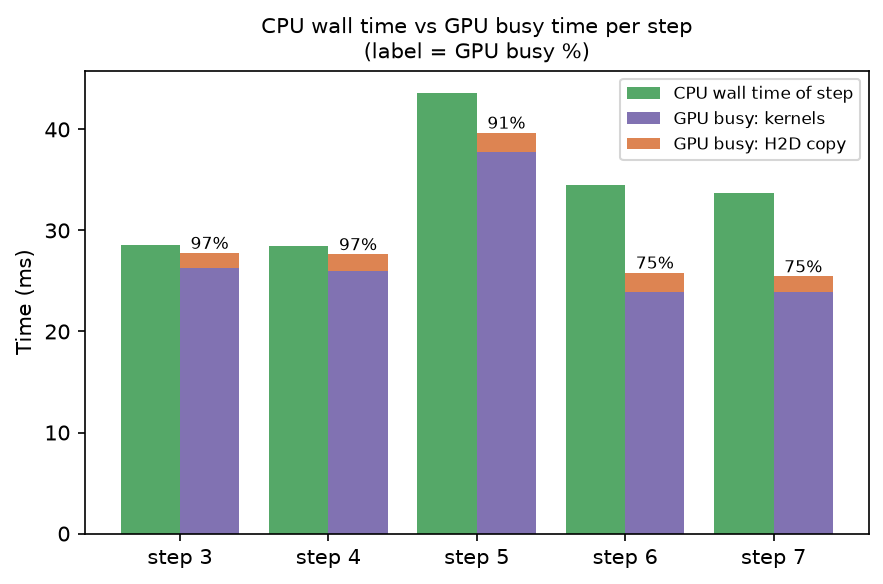
Figure 2. Wall time of each profiled step on the CPU, and the time the GPU was busy within it, split into kernels and the host-to-device copy of the batch (1.5–2.0 ms, orange). The label is GPU busy time as a share of the step.
The GPU is busy 97%, 97%, 91%, 75% and 75% of the five steps, which take 28–44 ms each. In the first three steps the GPU has work almost all the time. The drop in the last two steps comes from idle gaps like the one in Figure 1, not from slower kernels.
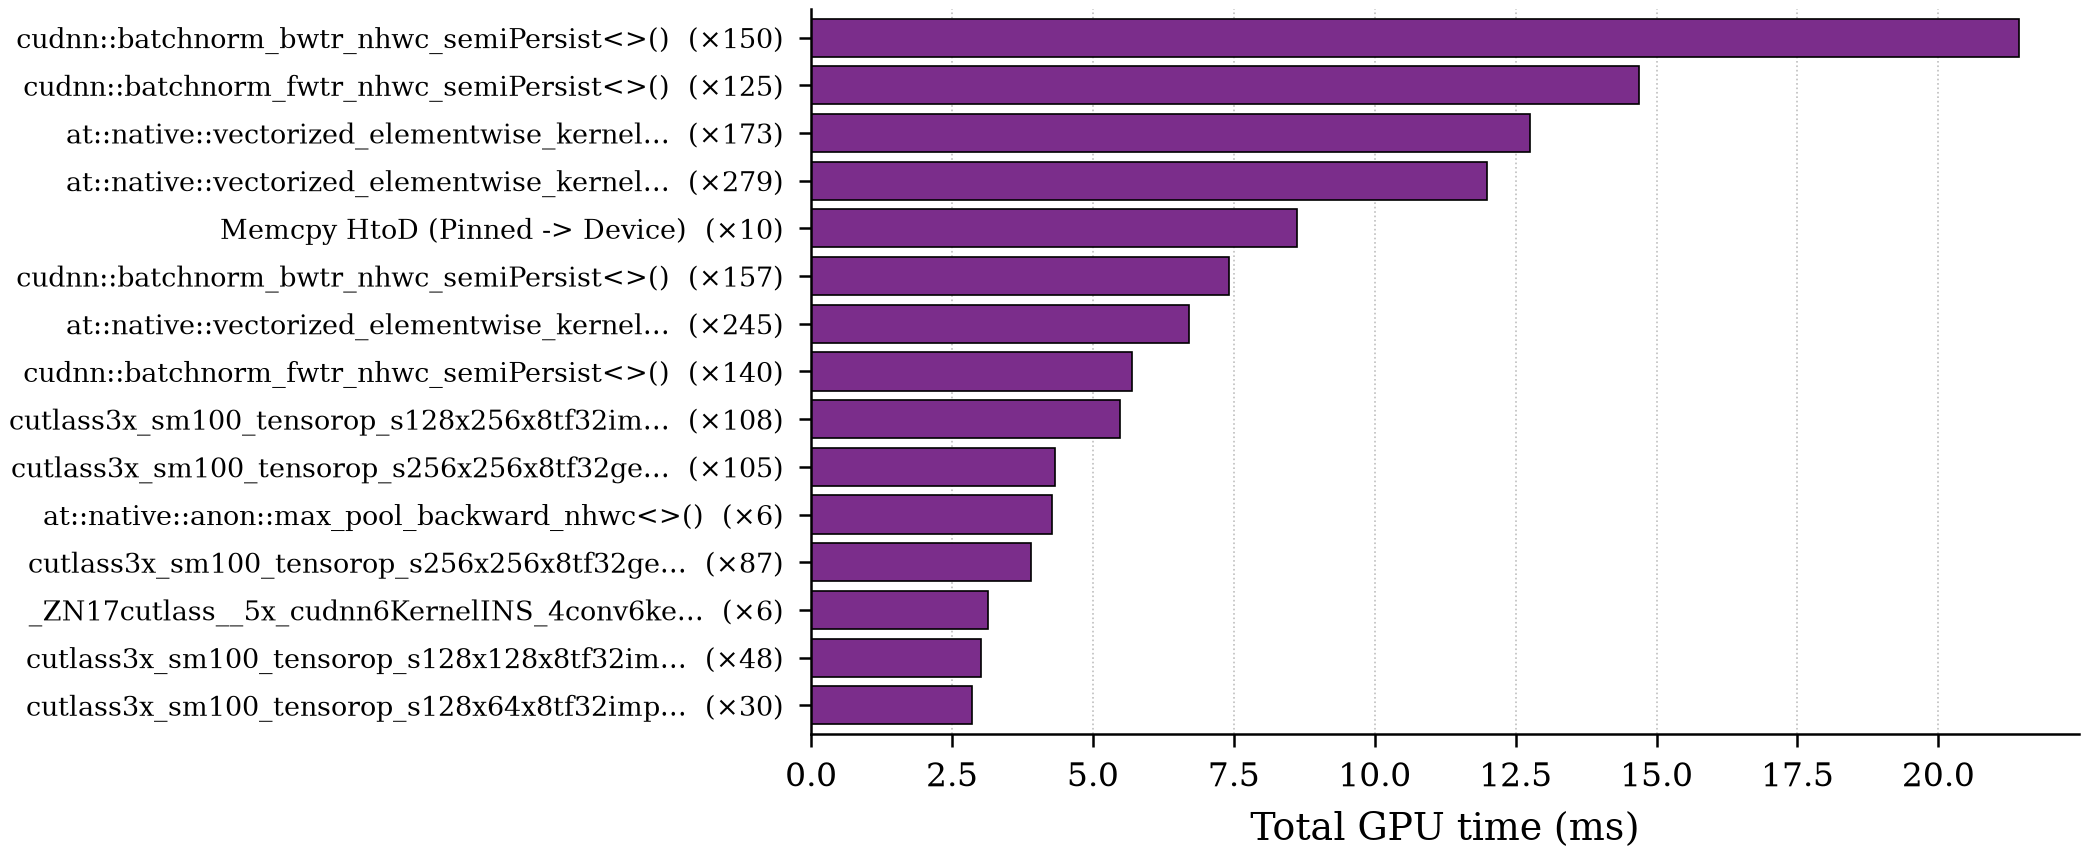
Figure 3. The GPU kernels with the most total time over the 5 active steps. The number in brackets is how many times each kernel ran.
- The two largest kernels are cuDNN batch norm (backward 21 ms, forward 15 ms), followed by elementwise kernels such as ReLU and the residual adds.
- Each convolution kernel ranks lower, at 3–5 ms. Convolution time is split across many CUTLASS kernel variants, each chosen for a different layer shape, so no single variant ranks high. Per operator (Figure 4), convolution is the largest.
- The
Memcpy HtoD (Pinned -> Device)row is the batch copy from Figure 1, about 9 ms over 10 copies.
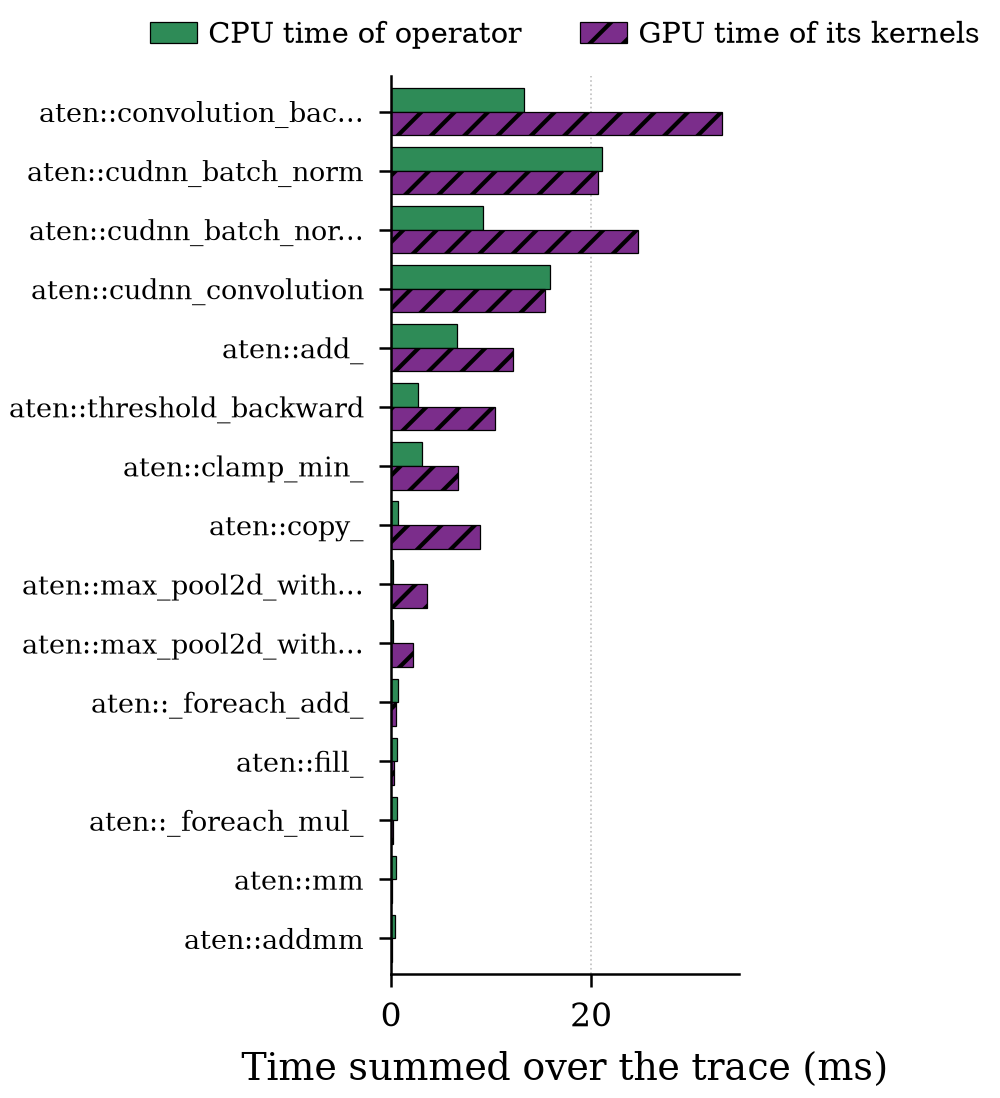
Figure 4. For each operator that launches GPU work: its CPU time, and the GPU time of the kernels it launched, summed over the 5 active steps.
aten::convolution_backwardspends about 13 ms on the CPU and 33 ms on the GPU. For this operator the GPU time is the larger one. For a model with small layers it is often the other way round.aten::copy_has almost no CPU time but about 9 ms of GPU time, because the copy runs asynchronously from pinned memory.
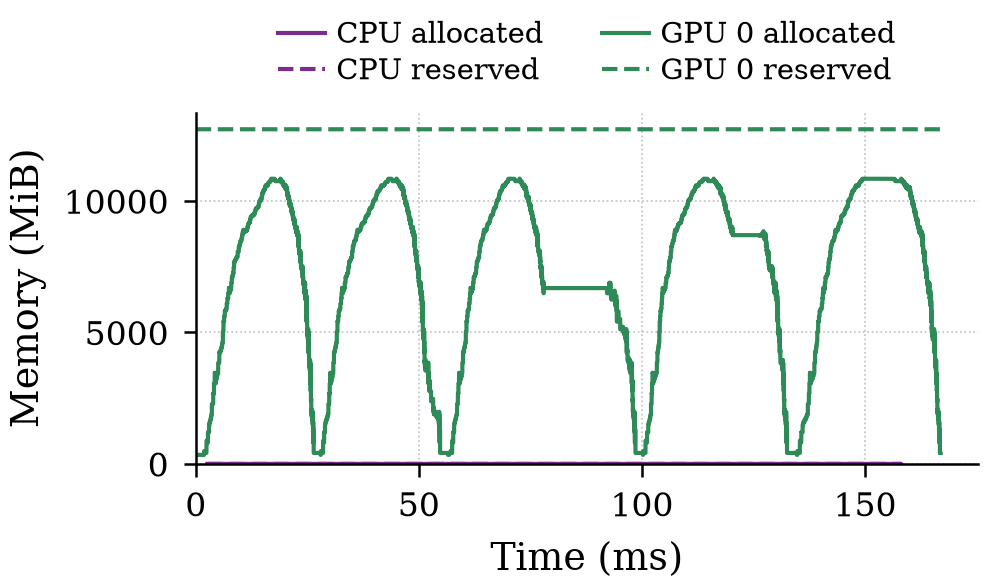
Figure 5. Memory held by PyTorch’s caching allocator during the 5 active steps. Solid: allocated by tensors. Dashed: reserved by the allocator from the driver.
Each step draws one arch. Allocated memory rises from about 0.3 GiB to 10.6 GiB during forward, as activations are saved for backward, and falls back as backward frees them. The flat parts are the idle gaps from Figure 2. Reserved memory stays at 12.4 GiB, because the allocator keeps freed blocks cached instead of returning them to the driver.
4. Three effects that shape the output
Observation 1 (CPU time and GPU time are different numbers). CUDA kernels launch asynchronously. The CPU time of the
forwardlabel is the time to launch its kernels, not to run them. In steps 3–6,forwardtakes 13.5–15.1 ms on the CPU. The 283 kernels it launches run for 10.3 ms on the GPU, over a span of 10.6 ms per step (the 53.091 ms ofSelf CUDAin the table, divided by 5 steps). In steps 3–5, those kernels finish 8.6–12.2 ms after the label has closed on the CPU.Insight. On its own, forward is launch-bound: the CPU needs about 15 ms to issue work that the GPU finishes in 10.3 ms. Yet Figure 2 shows the GPU 97% busy in steps 3 and 4. While the CPU launches forward, the GPU is still running the previous step’s backward, which takes 15.6 ms of GPU time per step. Per step, CPU and GPU are close to balanced: about 28.5 ms each.
Implication. Do not judge a phase from its label alone. Measured per phase, forward looks launch-bound; measured per step, the program is balanced. With the two sides this close, speeding up only one of them gains little. Fewer launches, from CUDA graphs or
torch.compile, would shift the bottleneck to the GPU, and faster kernels would shift it to the CPU.
Observation 2 (no host sync, so the CPU runs ahead). The training loop never reads a GPU value inside a step: the loss stays on the GPU (
loss.detach()) and is copied to the host once, after the loop. The trace confirms this. It contains noaten::itemoraten::_local_scalar_denseand nocudaStreamSynchronize, and every copy is acudaMemcpyAsync. The only sync is a singlecudaDeviceSynchronizeon the main thread after the last step. The profiler issues it itself when it stops, so that all GPU work is finished before the trace is collected. Without syncs, the CPU runs ahead of the GPU: in steps 3–5, the batch copy the CPU issues inh2d_copystarts on the GPU 11.7–13.9 ms later. In steps 6 and 7 the lag drops to 1.9 and 4.1 ms, because the gaps of Section 7 let the GPU catch up.Insight. The final
cudaDeviceSynchronizetakes 6.3 ms. That is how much work was still queued on the GPU when the CPU left the last step. A host read of a GPU value inside the loop would force this kind of wait in every step. Such reads include.item(),.cpu(),.tolist(),print(loss)and a Pythonifon a tensor. With a lag of up to 14 ms here, the CPU and GPU would take turns instead of overlapping. This effect is expected, not measured in this post.Implication. Without syncs, a step label measures CPU time only.
ProfilerStep#3closes on the CPU 14.2 ms before the last kernel it launched finishes. To find lost overlap, search the trace forcudaStreamSynchronize,cudaDeviceSynchronizeandaten::_local_scalar_dense. In a serving loop, these are usually in the sampler and the scheduler.
Observation 3 (backward runs on a different thread). On CUDA, autograd runs the backward pass on a separate engine thread,
pt_autograd_0(tid 3663546). That thread records 7,925 of the trace’s 12,690 operators and launches 1,200 of its 2,385 kernels. In step 7,backpropon the main thread lasts 10.1 ms. Under it the main thread records just 5 events:aten::ones_like,aten::fill_and a single kernel launch, which together create the loss’s starting gradient. In the same window, the autograd thread records 1,585 operators.Insight. Nesting in the trace follows threads, not the logical structure of your code. The
backproplabel is mostly the main thread waiting for the engine.Implication. Read backward from the autograd thread’s row and the GPU stream, not from the nesting under
backprop. A stall on that thread, like the ones in steps 5 and 6 (Section 7), appears underbackpropas unexplained time.
5. Options reference
Arguments of profile(...) [1]:
| Option | What it adds | Cost |
|---|---|---|
activities=[CPU, CUDA] | Host operators and GPU kernels; drop one to trace only the other | Baseline |
record_shapes=True | Input shapes per operator, which lets you group time by shape | Low to medium |
profile_memory=True | Allocation and free events of the caching allocator | Medium |
with_stack=True | Python and C++ source locations per operator | High. In Section 8 the trace grows from 3 to 4.5 MB per step, and Python-heavy steps run up to 1.7× slower |
with_flops=True | Estimated FLOPs for matmul and convolution operators | Low |
with_modules=True | The nn.Module hierarchy for each operator; TorchScript only, not eager mode | Low to medium |
schedule=schedule(skip_first, wait, warmup, active, repeat) | Captures only selected steps; call prof.step() once per iteration | Lowers total cost |
on_trace_ready=tensorboard_trace_handler(dir) | Writes one trace file per active window | Disk I/O at the end of each window |
The costs are qualitative. They depend heavily on how many operators run per step.
Related APIs.
torch.profiler.record_function("name")adds a named span for any code region.prof.key_averages(group_by_input_shape=True)orgroup_by_stack_n=N(withwith_stack=True) groups the summary by shape or by call site.torch.cuda.memory._record_memory_history()and_dump_snapshot()record every allocation together with its stack trace. This is a separate tool fromprofile_memory. Load the snapshot in the PyTorch memory viewer [2].torch.autograd.profiler.emit_nvtx()sends operator ranges to NVTX instead of Kineto, so they show up in nsys.
6. What it cannot see
- Attribution outside PyTorch and activity outside the process. CUDA activity from other libraries can appear, but may lack PyTorch operator attribution. The profiler does not provide a system-wide view of other processes.
- Inside a kernel. You get a kernel’s duration, not why it took that long. For that, use ncu.
- Which operator launched a kernel inside a CUDA graph. A replayed graph is a single
cudaGraphLaunchon the CPU, and noaten::operators run. With PyTorch 2.13 and CUDA 13.0, each kernel in the graph still appears on the GPU timeline, tagged with a graph ID and node ID, but it has noExternal id. So it cannot be tied back to an operator or a Python line. - How a collective runs. An all-reduce appears as an operator and a kernel, without the algorithm, protocol or transport.
- Why a thread records nothing. A silent interval may contain uninstrumented native work, a lock or GIL wait, or time off CPU. It is not a scheduling trace (Sections 7.6 and 8.4).
- Waits below the CUDA runtime API. It records how long a CUDA call took, not what the driver waited on inside it (Section 9.6).
7. Debugging session: the GPU gap in Figure 1
This section works through one question: why does the GPU sit idle for about 5 ms near the end of the forward pass? We allow ourselves only torch.profiler: the trace we already have, plus new runs with different profiler options. Nsight and other OS-level tools are off limits.
7.1 Notice the symptom
Figure 2 shows the GPU busy 97% of steps 3 and 4 but 75% of steps 6 and 7. The summary table in Section 3.6 cannot show this. It sums every operator over all 5 steps, so a few milliseconds of idle time in two steps disappear into the totals. To see the problem you need the trace, one step at a time.
7.2 Find the gaps
On the GPU stream (tid 7), merge all kernel, gpu_memcpy and gpu_memset events and list the holes longer than 1 ms. There are three, with times measured from the start of step 3:
| Step | Gap starts at | Length | Phase on the main thread |
|---|---|---|---|
| 5 | 91.9 ms | 1.6 ms | backprop |
| 6 | 121.8 ms | 6.0 ms | backprop |
| 7 | 152.0 ms (16.6 ms into step 7) | 4.9 ms | end of forward |
Steps 3 and 4 have none.
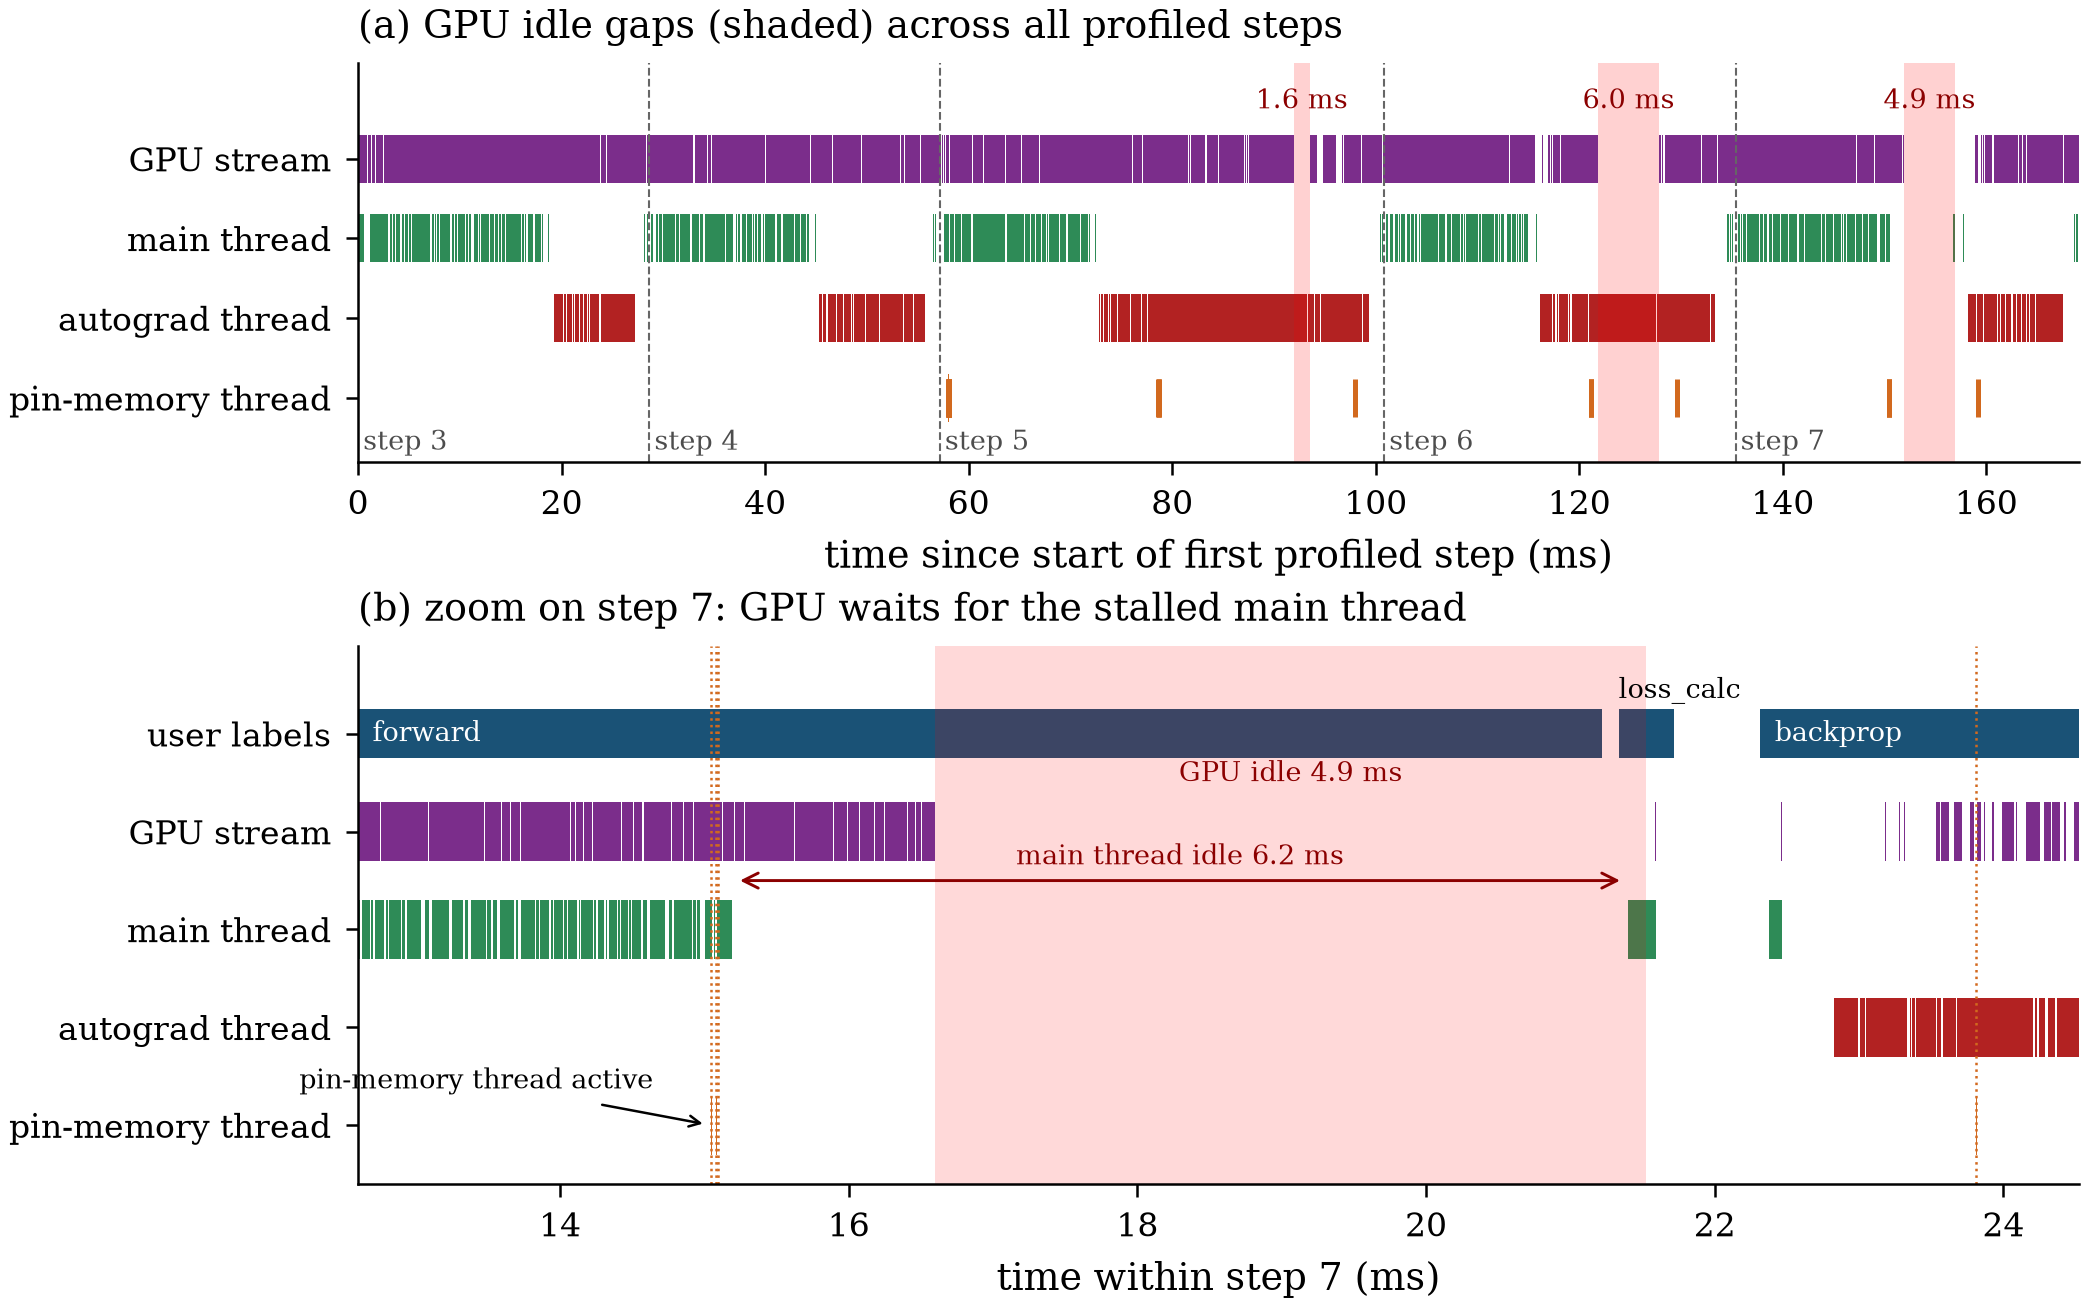
Figure 6. (a) All five profiled steps, one lane per thread. Times are measured from the start of step 3. Shaded bands mark where the GPU stream is idle for over 1 ms, and ticks on the bottom lane mark pin-memory thread events. (b) A zoom on the step 7 gap. The GPU drains its queue at 16.6 ms, but the main thread records no operator or CUDA call from 15.2 ms to 21.4 ms, right after the pin-memory thread becomes active. Appendix A lists the trace events behind panel (b).
7.3 Decide which side is waiting
Follow the last kernel before the gap back to its operator, using its correlation and External id, as in Section 3.7. These are the trace events on each side of the gap, with times in ms from the start of step 7:
t (ms)  cat           name                                  External id  correlation
15.106  cpu_op        aten::addmm                           40123        -
15.166  cuda_driver   cuLaunchKernel                        40123        364097
15.176  cuda_runtime  cudaLaunchKernelExC                   40123        364099
16.580  kernel        cutlass::Kernel2<..._sgemm_...>       40123        364097
16.598  kernel        cublasLt::splitKreduce_kernel<...>    40123        364099   <- last kernel, ends 16.601
                      ... GPU idle for 4.9 ms ...
21.436  cpu_op        aten::_log_softmax                    40128        -
21.483  cuda_runtime  cudaLaunchKernel                      40128        364112
21.524  kernel        softmax_warp_forward<...>             40128        364112   <- first kernel after the gap
The last kernel’s correlation (364099) matches the cudaLaunchKernelExC call, and that call’s External id (40123) matches aten::addmm. aten::addmm launches two kernels, a CUTLASS matrix multiply and a cuBLASLt split-K reduction, and the reduction is the last one to run.
- The last kernel belongs to
aten::addmm, the finalfclayer. That operator ends on the CPU at 15.2 ms, and its kernel ends on the GPU at 16.6 ms. - After that, no launch is queued for the GPU. The GPU is not slow here: it has run out of work, so it is waiting on the host.
- The first kernel after the gap is
softmax_warp_forward, fromloss_calc. It starts just after the main thread launches it at about 21.4 ms.
If a long kernel had filled the gap instead, the problem would be on the GPU, and the next tool would be ncu. Here it is on the host.
7.4 Look at every host thread during the gap
In Perfetto, select the gap’s time range and read every row in the process, not only the main thread.
- Main thread. No
cpu_op,cuda_runtimeorcuda_driverevent from 15.2 ms to 21.4 ms. Theforwardlabel stays open until 21.2 ms, so the thread is still insidemodel(images), after its last operator has returned. The only event in the window is a[memory]free at 21.1 ms. - Autograd thread. Idle, because backward has not started yet.
- A third thread. It records only
cudaPointerGetAttributesandcudaEventQuery, from 15.05 ms to 15.09 ms, just before the main thread goes quiet. These calls, and its position in the step, identify it as theDataLoader’s pin-memory thread. That thread runs inside the training process and copies each new 77 MB batch into pinned memory.
7.5 Check whether the pattern repeats
One coincidence proves little, so check the other two gaps.
- In steps 5 and 6 the gap falls in backward, so read the autograd thread. In both steps, the pin-memory thread is active, and within 0.15 ms the autograd thread enters an
autograd::engine::evaluate_function: CudnnBatchNormBackward0call. - These calls last 14.5 ms and 6.4 ms. The
aten::cudnn_batch_norm_backwardoperator inside them takes under 0.1 ms. As in step 7, the recorded operator does not account for most of the enclosing call’s duration; the trace does not establish whether the remaining time is waiting or uninstrumented work. - Steps 3 and 4 have no pin-memory activity near any long event, and no gap.
- The match is not one-to-one. The pin-memory thread is also active at a few moments that cause no stall.
7.6 State what the trace can and cannot say
The trace shows when a thread records no activity and what else is recorded at that moment. It does not show whether the silent thread is waiting or executing uninstrumented native work: torch.profiler records PyTorch and CUDA events, not locks or OS scheduling. The working hypothesis is that the pin-memory thread competes with the main and autograd threads for the Python GIL or for a CPU core. To test it, we need runs that change one thing at a time. Below, “freeze” is shorthand for the silent interval, not proof that the thread stopped running.
7.7 Narrow it down with more profiler runs
The checks below keep the model and batch size from Section 3. Sections 8 and 9 implement them with paired changes noted below, so those runs do not isolate every setting.
Add
with_stack=True. The trace then includespython_functionevents for Python frames. During the stall, the deepest open frame on the main thread locates the silent interval: inside a module’sforward, in a hook, or inModule.__call__bookkeeping. A frame with no nested events for 5 ms is consistent with a wait, but does not distinguish waiting from uninstrumented native work. Nested events can account for part of the interval.Done in Section 8.
Set
pin_memory=False. This removes the pin-memory thread. If the hypothesis holds, the gaps disappear and GPU busy time in Figure 2 returns to about 97% in every step. The cost moves elsewhere:h2d_copybecomes a copy from pageable memory, which is slower and blocks the main thread. Compare theMemcpy HtoDrows in the two summary tables.
Done in Section 9.2, which also disables non-blocking transfer and therefore is not a pinning-only test.
Profile more steps (
active=20). Five steps give three gaps. With more steps, count how many gaps start within 0.2 ms of pin-memory activity, and how many pin-memory events cause no gap. This turns the coincidence in Section 7.5 into a rate.Done in Section 8, in the same run as
with_stack=True.
7.8 What the session shows
Runs 1 and 3 are in Section 8. They strengthen the association with pin-memory activity and find a larger problem that five steps could not show. Run 2 (pin_memory=False) is in Section 9.2, together with the fixes.
The method carries over to other gaps. Find the idle time on the GPU stream, follow the last kernel back to its operator to see which side is waiting, then read every host thread in that window, not only the main one. torch.profiler can take you as far as “this thread recorded no activity while that thread recorded events”. Proving the cause takes controlled reruns, or a tool that sees the OS.
8. Rerun with with_stack=True over 20 steps
Section 7 ended with a hypothesis and three runs to test it. This section does runs 1 and 3 together: it turns on Python stacks and records 20 steps instead of 5. The question is whether the gap in Figure 1 happens once or keeps coming back, and what each thread is doing while it happens.
8.1 The change
Only the profiler arguments change. The model, loader and training step are the same as in Section 3.
 train_step(3)

-wait, warmup, active = 1, 2, 5
+wait, warmup, active = 1, 2, 20
 with profile(
     activities=activities,
     schedule=schedule(wait=wait, warmup=warmup, active=active, repeat=1),
     record_shapes=True,
     profile_memory=True,
+    with_stack=True,
 ) as prof:
     train_step(wait + warmup + active, prof=prof)

-prof.export_chrome_trace("trace.json")
+prof.export_chrome_trace("stack_trace.json")
The recorded steps are now ProfilerStep#3 to ProfilerStep#22. The cost shows up in the file size. The 5-step trace was 15.3 MB, about 3 MB per step. The 20-step trace with stacks is 91.0 MB, about 4.5 MB per step. It holds 101,205 python_function events, twice as many as the 50,760 cpu_op events. Python tracing also slows down threads that run mostly Python, such as the pin-memory thread. Trust the pattern in this run more than the exact milliseconds.
8.2 What the raw trace looks like
with_stack=True adds one python_function event for each Python call, built-ins included. name holds file(line): function for Python code, or <built-in method ...> for C functions. Python id and Python parent id link each call to its caller, which is how Perfetto rebuilds the stack. Below are six events from step 7, unchanged except that the ts values are shortened. The tid field identifies the thread: 3663150 is the main thread and 3669897 is the pin-memory thread.
{"ph": "X", "cat": "python_function", "name": "<built-in method add_ of Tensor object at 0x7ed1d2730690>",
 "tid": 3663150, "ts": ...716898.418, "dur": 13.056,   "args": {"Python parent id": 20958, "Python id": 20963}}
{"ph": "X", "cat": "python_function", "name": "<built-in method pin_memory of Tensor object at 0x7ed479ef3110>",
 "tid": 3669897, "ts": ...717048.946, "dur": 108.765,  "args": {"Python parent id": 20993, "Python id": 20995}}
{"ph": "X", "cat": "python_function", "name": "torch/nn/modules/batchnorm.py(176): forward",
 "tid": 3663150, "ts": ...717079.177, "dur": 9916.523, "args": {"Python parent id": 20998, "Python id": 21000}}
{"ph": "X", "cat": "python_function", "name": "<built-in method add_ of Tensor object at 0x7ed1d2730690>",
 "tid": 3663150, "ts": ...717082.561, "dur": 9696.85,  "args": {"Python parent id": 21000, "Python id": 21005}}
{"ph": "X", "cat": "python_function", "name": "threading.py(601): is_set",
 "tid": 3669897, "ts": ...726385.452, "dur": 0.825,    "args": {"Python parent id": 51, "Python id": 21006}}
{"ph": "X", "cat": "cpu_op", "name": "aten::add_",
 "tid": 3663150, "ts": ...726388.694, "dur": 369.104,  "args": {"External id": 53293}}
Read the events in time order:
- Line 1. A normal call.
BatchNorm2d.forwardrunsself.num_batches_tracked.add_(1)once per layer, and this call takes 13 µs. - Line 2. The pin-memory thread pins the second, small tensor of the next batch (the labels). This call ends at
...717157.7. - Lines 3–4. The main thread enters the next
BatchNorm2d.forwardand calls the sameadd_. This time the call takes 9,697 µs. - Line 5. The pin-memory thread records nothing for 9.23 ms after
pin_memoryreturns. Its next event isdone_event.is_set(). - Line 6. The
aten::add_operator inside the long call starts 3.2 µs after the pin-memory thread’s next recorded event.
The main thread’s time is spent before the operator starts, not inside it. The silent intervals on the two threads end within microseconds of each other. Section 8.4 interprets this.
8.3 The picture over 20 steps
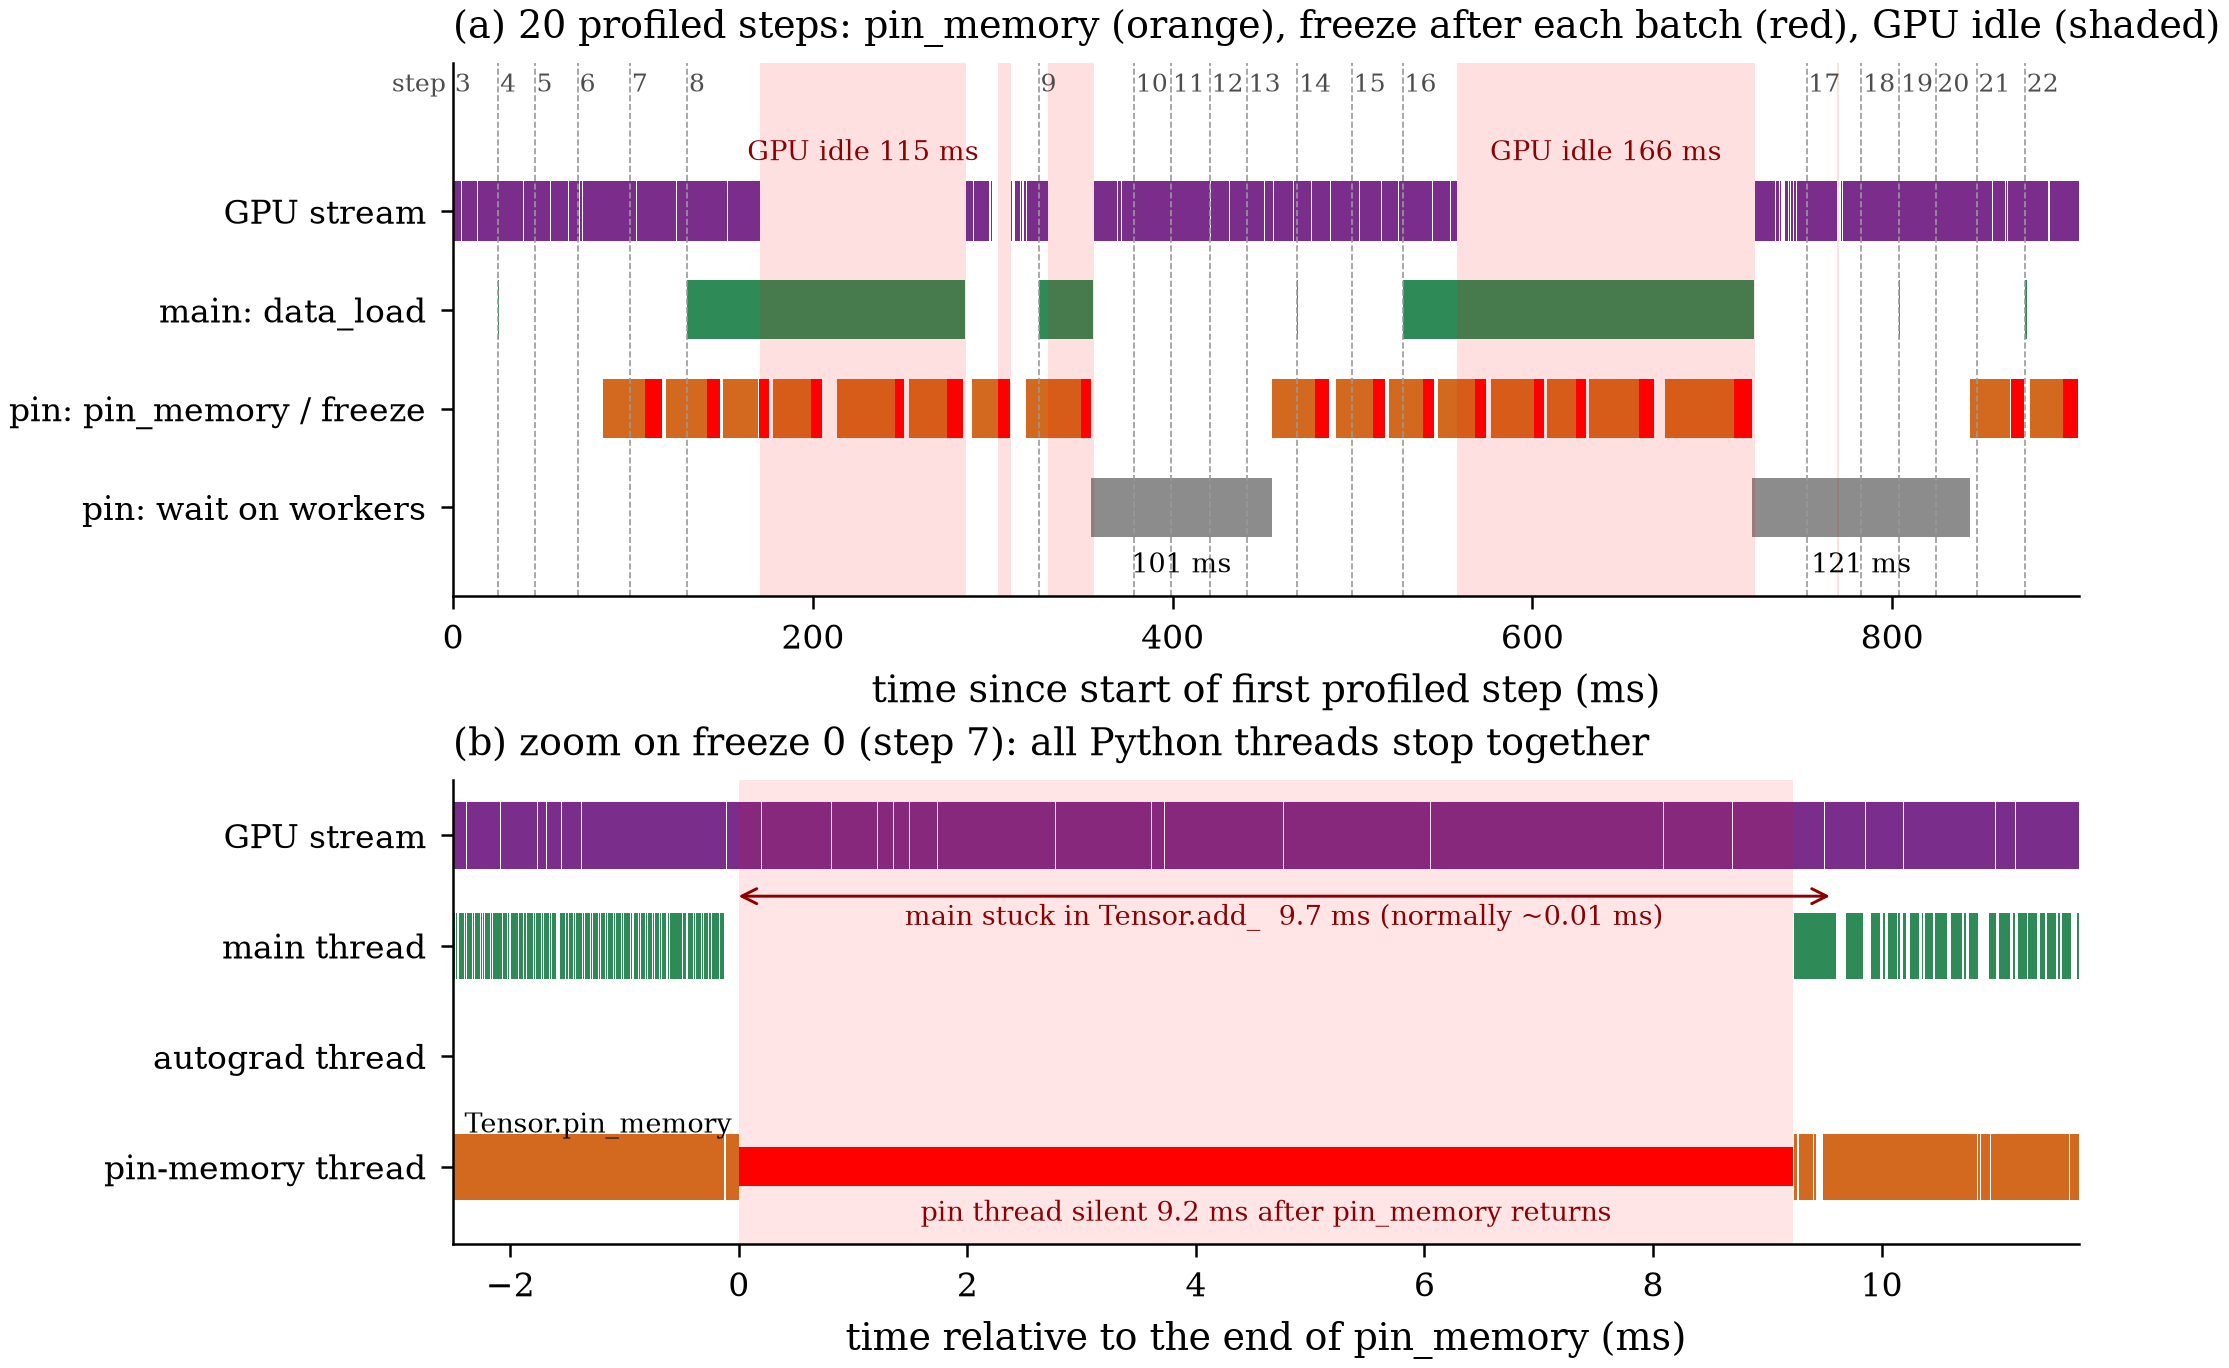
Figure 7. (a) All 20 profiled steps. Lanes, top to bottom: GPU stream; main-thread data_load ranges; pin-memory thread, with each Tensor.pin_memory call on the 77 MB image tensor in orange and the silent stretch after it in red; and pin-memory thread waits on the worker queue longer than 20 ms. Shaded bands mark where the GPU is idle for over 1 ms; only bands over 50 ms are labelled, and the third large band, in step 9, is 25 ms. (b) A zoom on the first freeze, in step 7’s forward. Time 0 is when pin_memory returns. Both threads show about 9.5 ms of trace silence, and the GPU stays busy on work queued earlier.
The per-step numbers behind panel (a):
| Step | Step time | GPU busy | data_load | GPU idle > 1 ms |
|---|---|---|---|---|
| 3–7 | 20–32 ms | 96–98% | 0.2–0.3 ms | none |
| 8 | 195.4 ms | 32% | 154.7 ms | 114.7 ms (data_load), 7.5 ms (backprop) |
| 9 | 52.9 ms | 51% | 30.2 ms | 25.4 ms (data_load) |
| 10–15 | 20–30 ms | 97–98% | 0.1–0.2 ms | none |
| 16 | 224.4 ms | 24% | 195.5 ms | 166.0 ms (data_load) |
| 17 | 30.4 ms | 90% | 0.2 ms | 1.4 ms (backprop) |
| 18–22 | 20–30 ms | 97–98% | 0.1–0.8 ms | none |
The 20 steps take 902.6 ms. The GPU is idle for 315 ms of that time in gaps over 1 ms, and 306 ms of those come from the three data_load stalls.
8.4 What we learn
The gaps repeat, and there are two kinds.
Long input stalls, in steps 8, 9 and 16. These were not in the 5-step run. The main thread waits for a batch for 155, 30 and 195 ms, and the GPU drains its queue and sits idle.
- The stack shows where the main thread waits:
dataloader.py(1468): _next_data→_get_data→_try_get_data→queue.py(154): get→<built-in method acquire of _thread.lock>. That is the output queue of the pin-memory thread. - The pin-memory thread is waiting too. Each
multiprocessing/queues.py(98): geton the worker queue normally returns in 1.6–8.7 ms, but two calls take 101.0 ms and 121.2 ms. At those moments no worker has a batch ready. - So the 8 worker processes cannot decode and augment images as fast as the GPU trains on them. The prefetched batches cover the shortfall for a few steps, then run out. In this run that happened twice, 8 steps apart. Whether the period is always 8, which equals
num_workers, needs a longer run.
- The stack shows where the main thread waits:
A short freeze after every batch is pinned. All 18 batches pinned during the 20 steps show it.
- After the image tensor (14–39 ms, median about 22 ms) and then the label tensor are pinned, the pin-memory thread records nothing for 5.0–9.8 ms (mean 6.9 ms). The 18 freezes add up to 125 ms, 14% of the run.
- The stack places each freeze at the same line of
_pin_memory_loop.do_one_step:data = pin_memory(data, device). The next recorded call isdone_event.is_set(), the condition of thewhileloop that follows.
- In all 18 freezes the main thread records no event either, whatever it is doing at the time. In step 7 it is inside
BatchNorm2d.forward(Figure 7b); in steps 21 and 22 it is inoptimize_step. Recorded activity on the two threads resumes within microseconds of each other. - A freeze costs GPU time only if the GPU queue is shorter than the freeze. In step 7 the GPU still has work queued, so nothing is lost. In step 8
backpropthe queue runs dry and the GPU idles for 7.5 ms. This is the same pattern as the 4.9–6.0 ms gaps in Section 7.2.
What the profiler cannot tell us. It shows overlapping silent intervals whose recorded activity resumes together. GIL contention is one hypothesis, not an observed lock wait. Shared-memory cleanup is another candidate suggested by the line number: rebinding data, and then r, may release the last references to the worker’s 77 MB batch and trigger unmapping. The trace records neither the lock nor the unmapping, and cannot distinguish these mechanisms from other uninstrumented native work or scheduling delays.
What the recorded CUDA calls explain. The pin-memory thread’s CUDA calls are tiny. Its 57 cudaEventQuery and 38 cudaPointerGetAttributes calls add up to 0.40 ms and 0.31 ms over the whole run. The recorded CUDA calls do not account for the freeze duration.
Why 20 steps mattered. With 5 steps, the gap looked like a 5 ms problem near the end of forward. With 20, the freeze shows up after every batch, and its cost depends on how much work the GPU has queued. The 115–166 ms input stalls only appear once the prefetched batches run out, which is after the end of a 5-step window. They cost more GPU time than everything else in the post.
What to try next. Section 9 measures each of these.
- Pin-memory thread throughput. Each batch costs about 22 ms of pinning plus about 7 ms of freeze, on one thread. That is roughly the same as a 20–30 ms training step, so the thread barely keeps up. Return
uint8images from the workers and normalise on the GPU. This makes each batch a quarter of the size (19 MB instead of 77 MB), which should shorten both the pinning and the free. - Worker throughput. Raise
num_workersandprefetch_factor, or move decoding and augmentation to the GPU, for example with DALI ortorchvision.io.decode_jpegon CUDA. - Run 2 from Section 7.7 (
pin_memory=False). This removes the pin-memory thread, but the implemented run also changes transfer synchronization, so it cannot isolate pinning’s effect.
9. Trying the fixes
Section 8 found two patterns: long waits for batches and short silent intervals after every pinned batch. This section compares the input configurations suggested in Section 8.4 and checks each with the profiler. Some configurations change multiple settings, so they measure the combined effect rather than isolate each cause.
All runs use the same loader_runs.py harness. The model, batch size and training step are the same as in Section 3. Each run does two things:
- A profile. 20 steps with
with_stack=True, the same schedule as Section 8. This shows where the time goes. - A benchmark. 300 more steps without the profiler, on the same iterator, after 20 untimed steps that let the prefetch queue fill. This gives images per second and, for every step, how long
next(batches)waited. Python tracing slows the profiled runs, so throughput numbers come only from the benchmark.
The step timer also records the loader wait:
t = time.perf_counter()
with record_function("data_load"):
    images, labels = next(batches)
waits.append((t, time.perf_counter() - t))
9.1 The baseline and the input-free reference
To know how fast the input pipeline must be, first remove it. The synthetic run keeps one random batch on the GPU and trains on it in every step:
-batches = iter(food_loader)
+fixed = (torch.randn(128, 3, 224, 224, device=device),
+         torch.randint(0, 101, (128,), device=device))
+batches = itertools.repeat(fixed)
That run takes 26.7 ms per step, or 4,801 images/s, with the GPU busy 96.7% of the profiled time. It is the input-free throughput reference for this training configuration, not a hardware utilization metric or a universal upper bound. Every other run is reported as a fraction of it.
The baseline, the Section 3 loader unchanged, reaches 2,393 images/s, 50% of the input-free reference throughput. Over 300 steps it waits 9.7 s for batches, 32 ms per step on average, which is more than a whole training step. Figure 8 shows the rerun profile. The total is 947.5 ms against 902.6 ms in Section 8, and the stalls land in different steps, because the shuffle order differs from run to run. The pattern is the same.
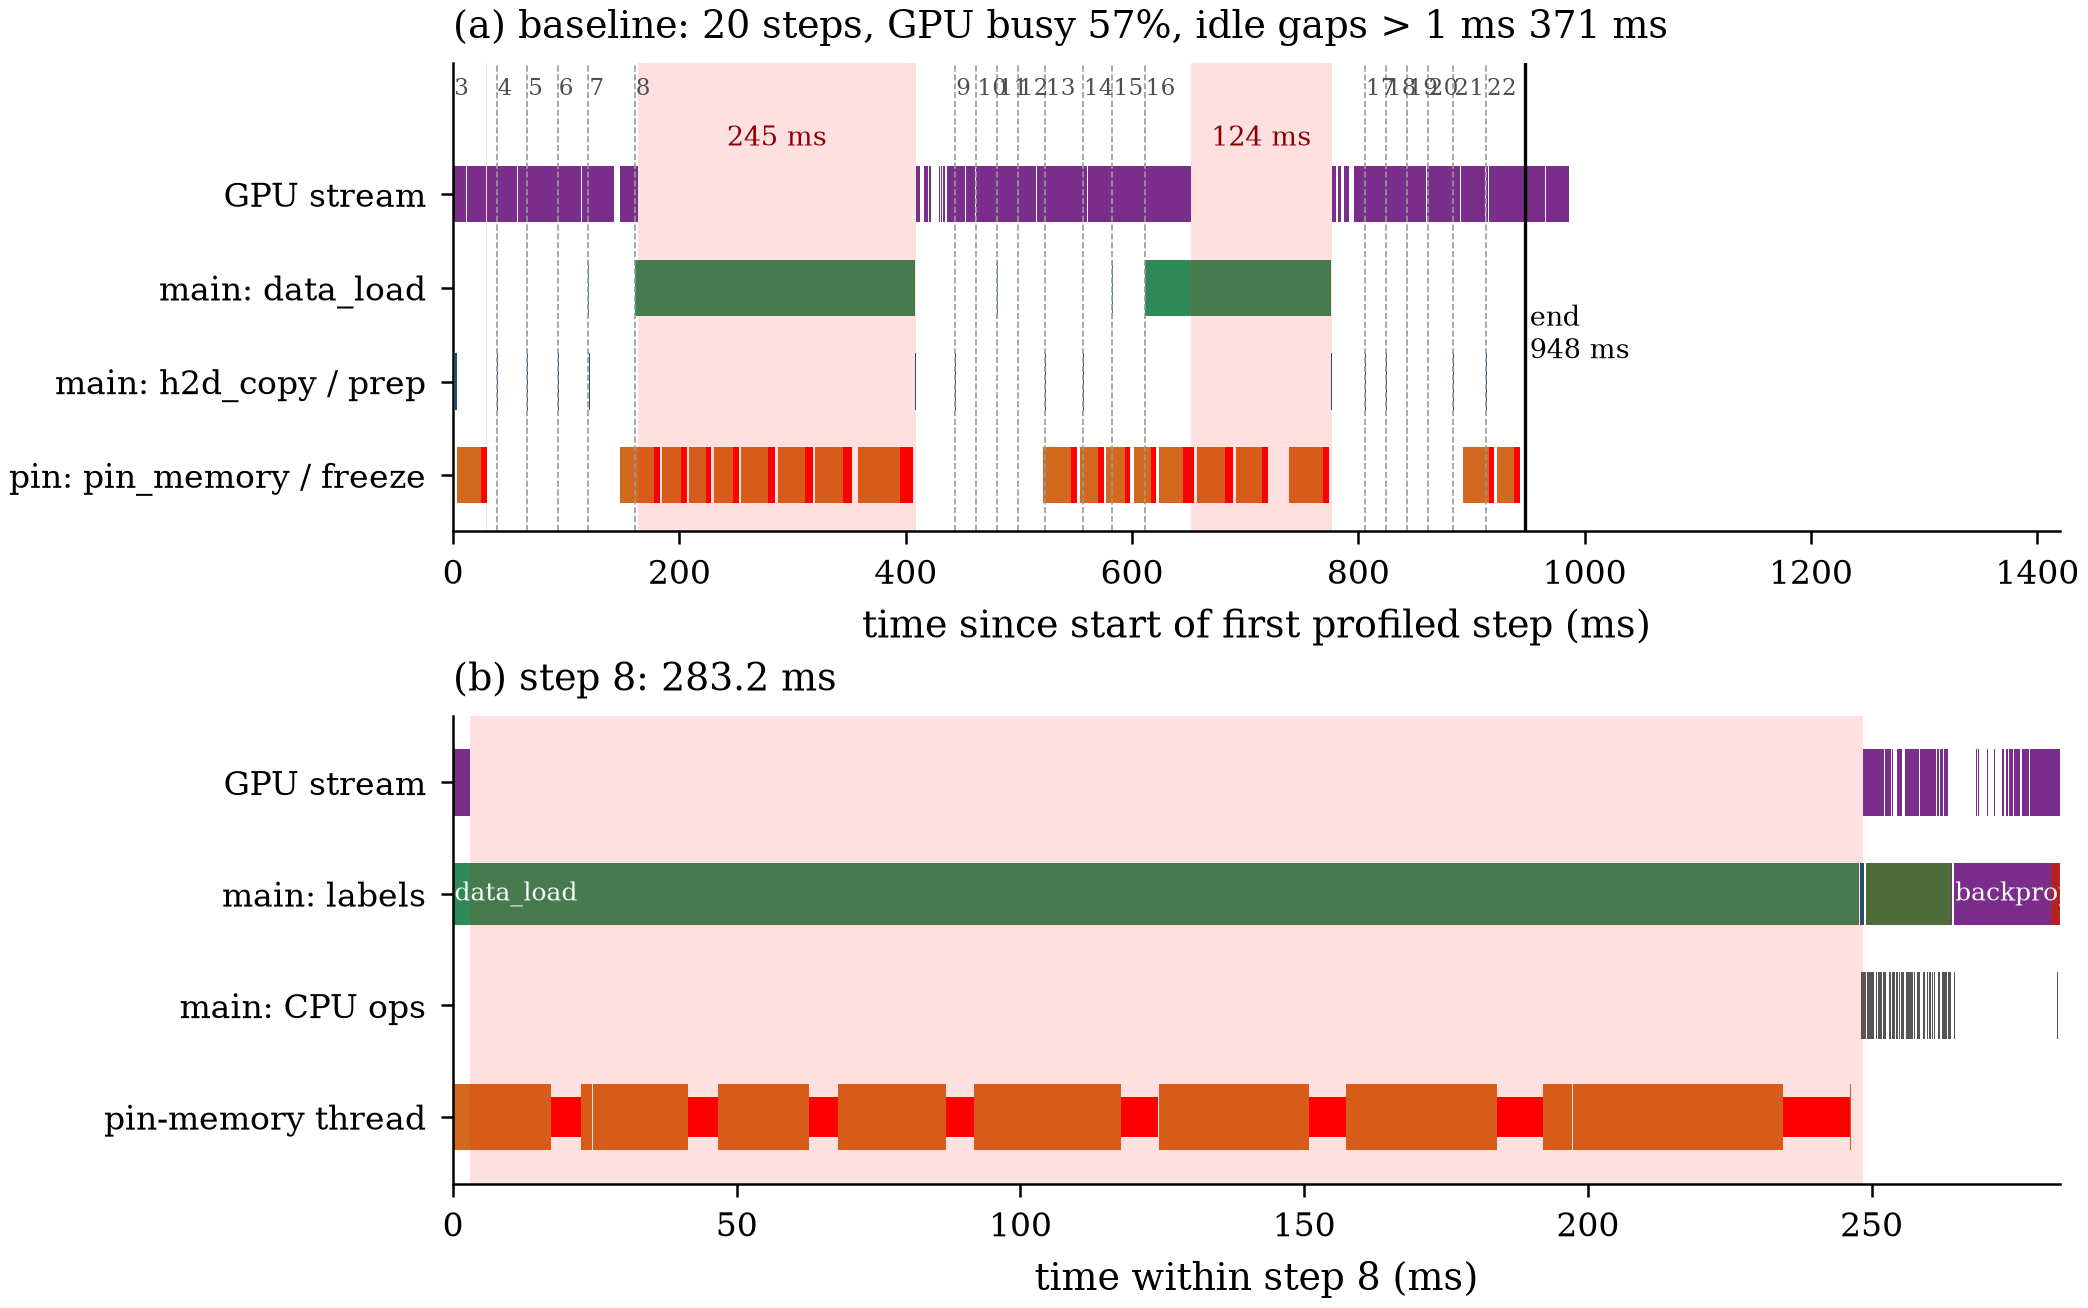
Figure 8. Baseline rerun (pin_memory=True, float32 batches, 8 workers). (a) 20 profiled steps. Lanes: GPU stream; main-thread data_load; main-thread h2d_copy and preparation; pin-memory thread, with pin_memory calls in orange and the freeze after each in red. Shaded bands are GPU idle time over 1 ms. (b) Step 8. While the main thread waits 245 ms in data_load, the pin-memory thread pins nine batches back to back, about 28 ms each including the freeze.
Panel (b) adds something Section 8 did not show. When a wave of batches arrives from the workers, the single pin-memory thread needs about 22 ms to pin each one and another 6 ms in the freeze. That is about 28 ms per batch, slightly more than the 26.7 ms the GPU needs per step. So even with infinitely fast workers, this thread would only just keep up.
9.2 pin_memory=False
This is Run 2 from Section 7.7. It disables both pinning and non-blocking transfer, so it compares two transfer configurations rather than isolating pinning alone. non_blocking=True can omit PyTorch’s explicit post-copy synchronization even with pageable memory, although staging can still block the host.
 food_loader = DataLoader(
     ...
-    pin_memory=True,
+    pin_memory=False,
     ...
 )
 ...
 with record_function("h2d_copy"):
-    images = images.to(device, non_blocking=True, memory_format=torch.channels_last)
+    images = images.to(device, memory_format=torch.channels_last)
The trace has no pin-memory thread and no freezes. The cost moves to h2d_copy on the main thread. These are the events for that copy in step 10 (ts omitted):
{"cat": "user_annotation", "name": "h2d_copy",          "dur": 23090}
{"cat": "cpu_op",          "name": "aten::to",          "dur": 17859, "args": {"Input Dims": [[128, 3, 224, 224]], "Input type": ["float"]}}
{"cat": "cuda_runtime",    "name": "cudaMemcpyAsync",   "dur": 17812}
{"cat": "gpu_memcpy",      "name": "Memcpy HtoD (Pageable -> Device)", "dur": 11563}
cudaMemcpyAsync keeps the main thread for 17.8 ms. From pageable memory, the driver first copies the 77 MB batch into its own pinned staging buffer, and the call does not return until that is done. The GPU side of the copy then takes 11.6 ms. With pinned memory the same copy took 1.9 ms on the GPU and returned to the main thread at once.
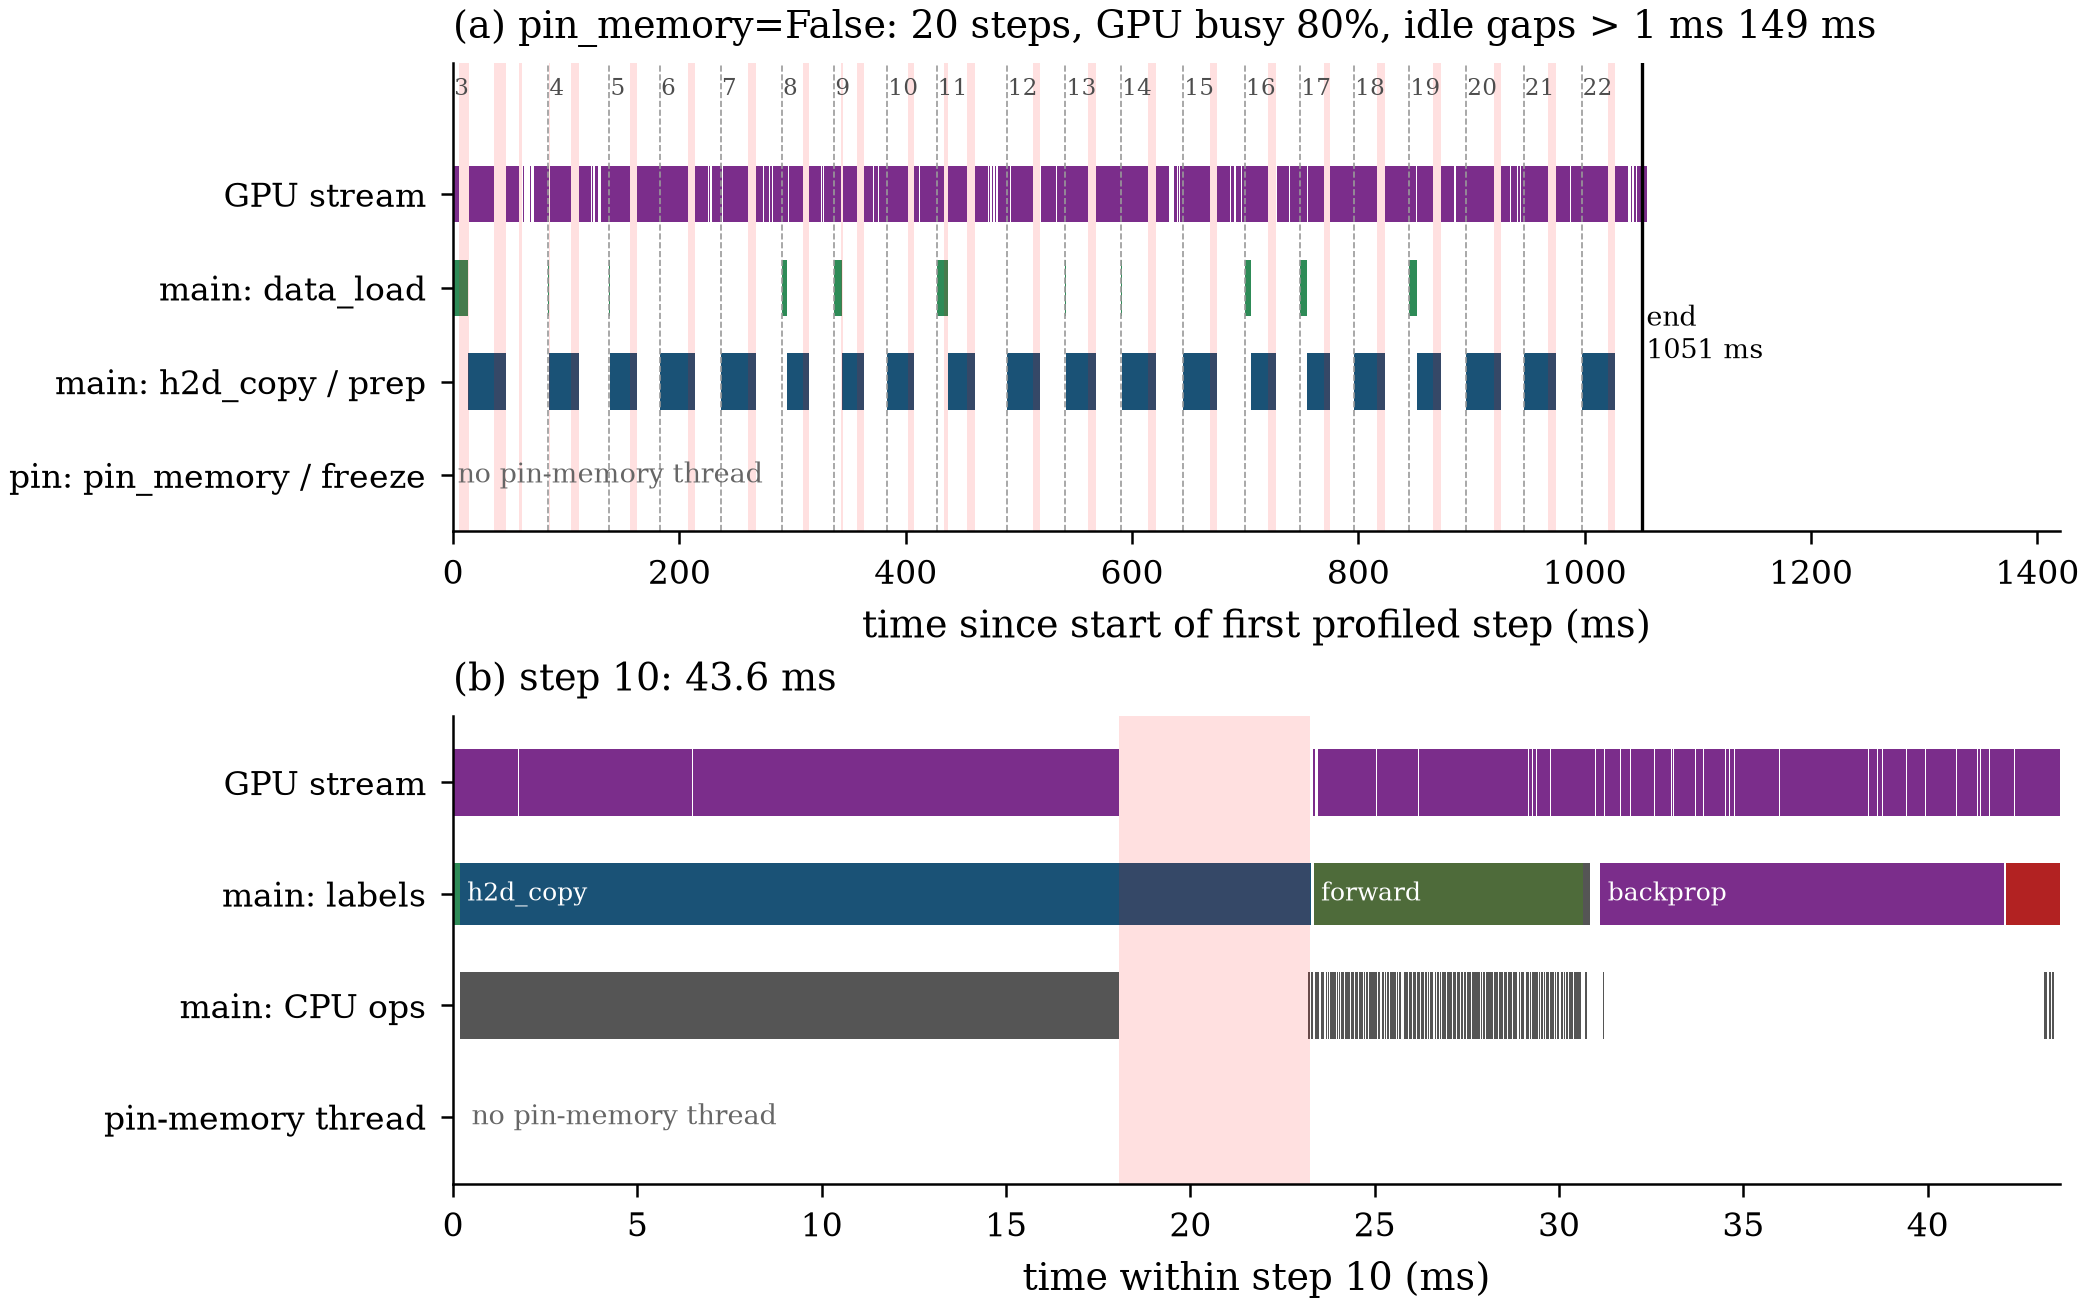
Figure 9. pin_memory=False. (a) The long data_load stalls are mostly gone, and the pin-memory lane is empty. Instead, a short idle band appears in every step, at the end of h2d_copy. (b) Step 10. The main thread spends 18 ms in one aten::to call. The GPU finishes the previous step at 18 ms and is idle until the copy ends at 23 ms.
What we learn.
- The pinning-associated freezes disappear in this configuration. This supports an association with the pin-memory path, but does not establish the GIL or unmapping mechanism proposed in Section 7.6 and Section 8.4.
- This transfer configuration does not help. GPU busy rises from 57% to 80% in the profile, but the pageable copy costs about 27 ms of main-thread time per step (median of
h2d_copy). 132 ms of the 149 ms GPU idle time is now inh2d_copy. The benchmark gives 2,281 images/s, slightly slower than the baseline. - Keep pinning for the next comparison. The baseline’s pinned, non-blocking configuration is faster than this pageable, blocking configuration. That does not isolate the benefit of pinning alone. The next run retains the baseline transfer settings and reduces the bytes pinned.
9.3 Send uint8 batches and normalise on the GPU
ToTensor converts each image to float32, which makes it 4 times larger than the decoded uint8 pixels. That conversion and Normalize run in the workers, and the 77 MB result is then sent through shared memory, pinned, and copied. PILToTensor keeps the pixels as uint8, so a batch is 19 MB. The GPU does the conversion and normalisation instead:
 food_tf = transforms.Compose([
     transforms.RandomResizedCrop(224),
     transforms.RandomHorizontalFlip(),
-    transforms.ToTensor(),
-    transforms.Normalize([0.485, 0.456, 0.406], [0.229, 0.224, 0.225]),
+    transforms.PILToTensor(),
 ])
+mean = torch.tensor([0.485, 0.456, 0.406], device=device).view(1, 3, 1, 1) * 255
+std = torch.tensor([0.229, 0.224, 0.225], device=device).view(1, 3, 1, 1) * 255
 ...
 with record_function("h2d_copy"):
-    images = images.to(device, non_blocking=True, memory_format=torch.channels_last)
+    images = images.to(device, non_blocking=True)
     labels = labels.to(device, non_blocking=True)
+with record_function("gpu_normalize"):
+    images = ((images.float() - mean) / std).contiguous(memory_format=torch.channels_last)
The pin-memory thread in step 16, same format as Section 8.2. 3685935 is the pin-memory thread:
{"cat": "python_function", "name": "<built-in method pin_memory of Tensor object at 0x7585dd3cae90>",
 "tid": 3685935, "ts": ...408550.387, "dur": 5172.403}
{"cat": "python_function", "name": "<built-in method pin_memory of Tensor object at 0x7585dd3cae90>",
 "tid": 3685935, "ts": ...413729.288, "dur": 35.326}
{"cat": "python_function", "name": "threading.py(601): is_set",
 "tid": 3685935, "ts": ...415594.107, "dur": 0.468}
The image tensor is pinned in 5.2 ms, then the labels. The thread then records nothing for 1.83 ms before is_set(), which is the same freeze as before, only shorter. On the main thread, gpu_normalize takes 0.24 ms and Memcpy HtoD (Pinned -> Device) takes 0.57 ms.
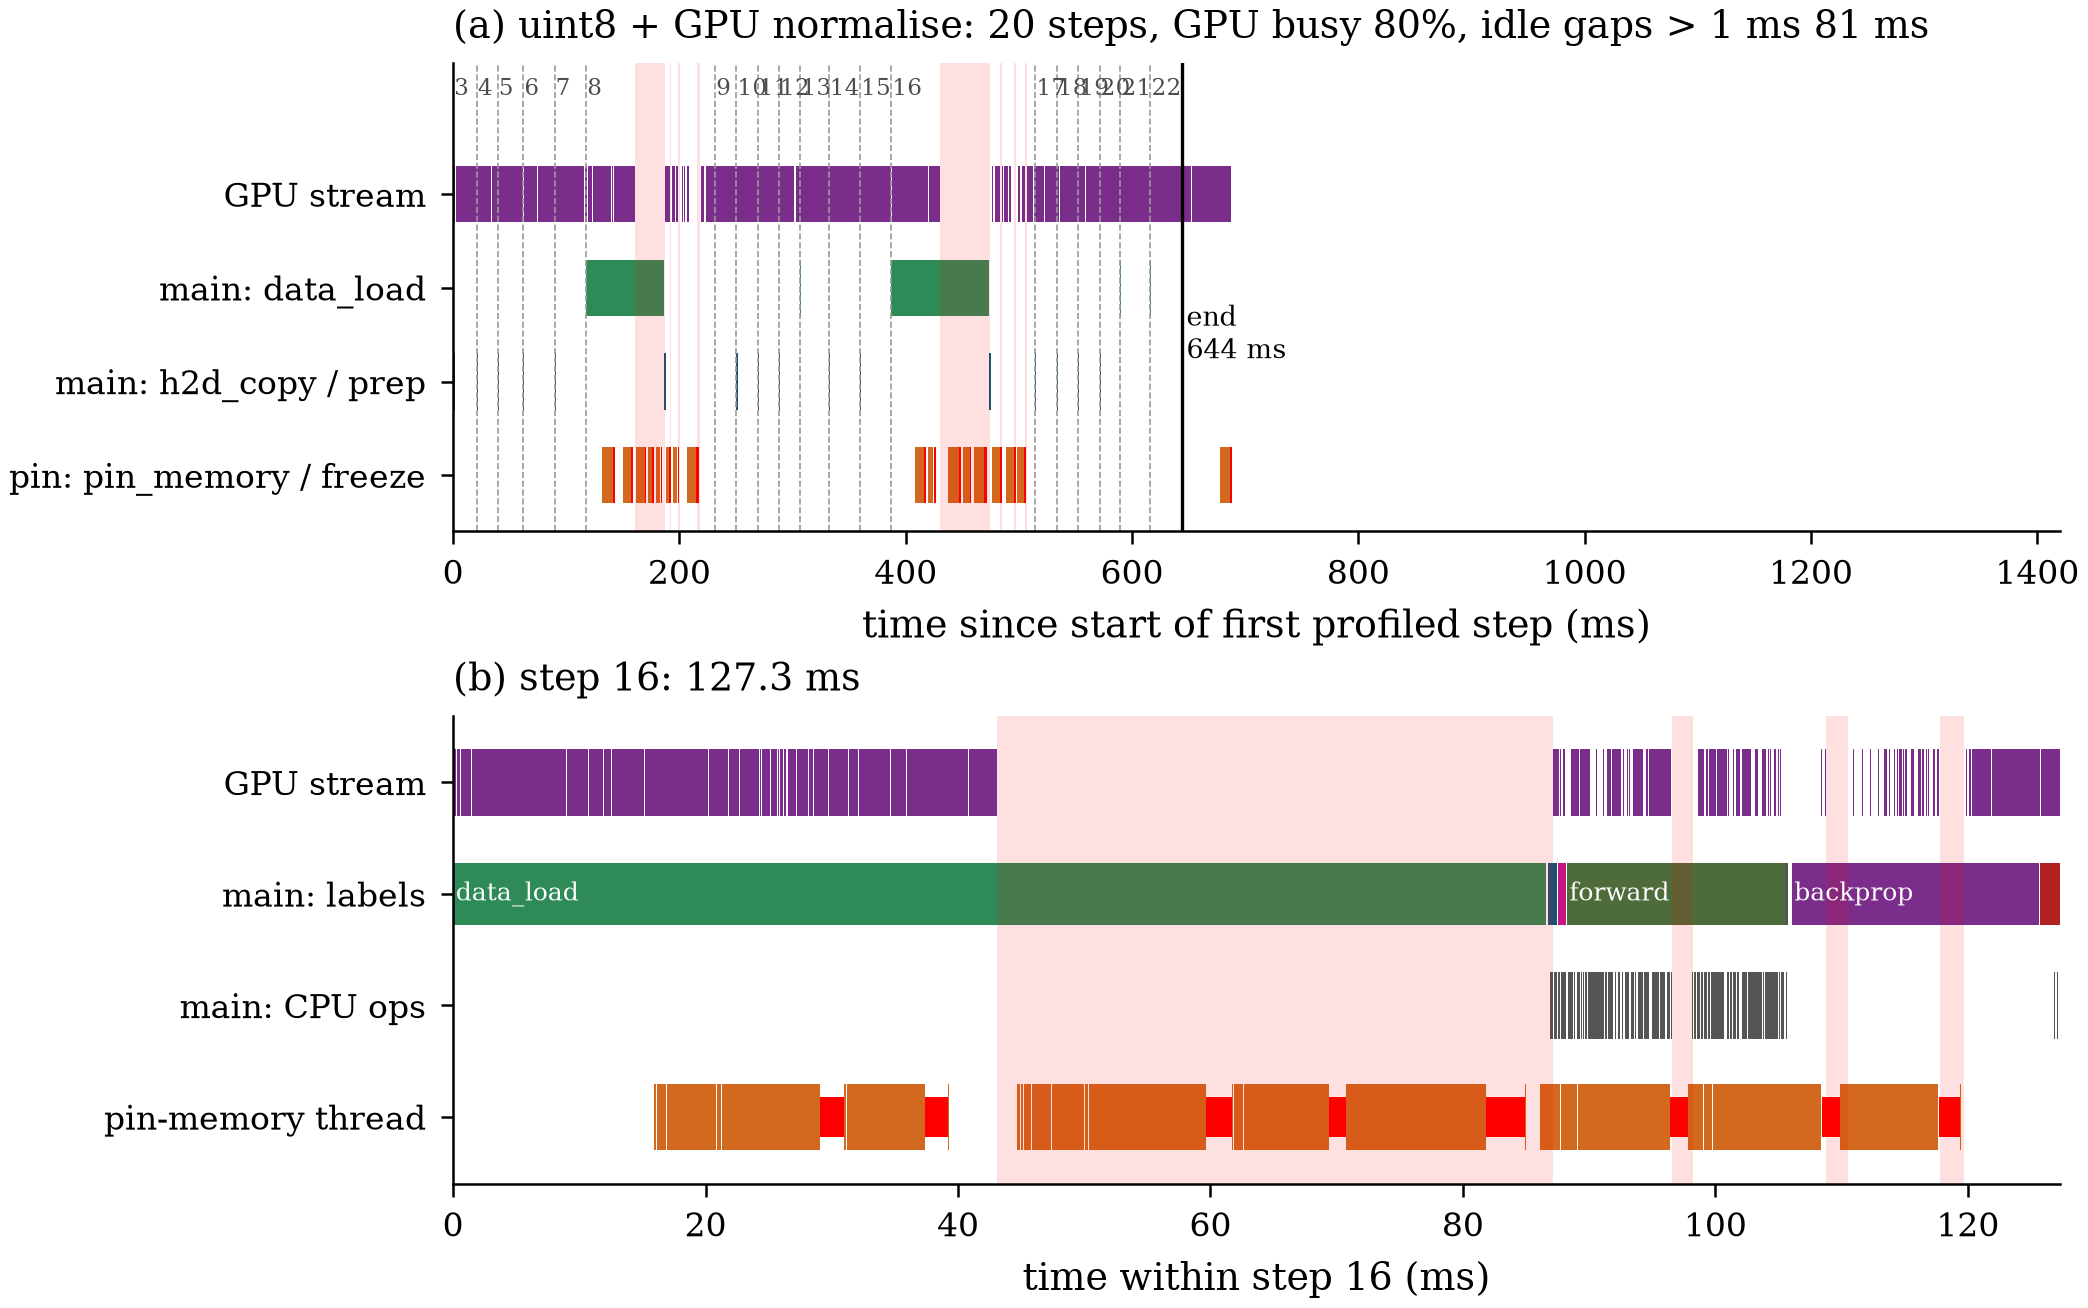
Figure 10. uint8 batches, normalised on the GPU, 8 workers. (a) Most steps are short and the GPU is busy, but long data_load stalls remain in steps 8 and 16. (b) Step 16. The main thread waits 86.6 ms. When the next wave of batches arrives, the pin-memory thread pins several of them back to back, and the main thread gets its batch only after that. Once training resumes, the GPU queue is short, and three freezes (red) line up with short GPU idle bands in forward and backprop.
Each stage that handles the batch got faster, by close to the 4× size reduction:
| float32 (baseline) | uint8 | ratio | |
|---|---|---|---|
pin_memory per batch (median) | 22.8 ms | 7.3 ms | 3.1× |
| Freeze after pinning (mean) | 6.2 ms | 1.8 ms | 3.5× |
Memcpy HtoD on the GPU (median) | 1.92 ms | 0.57 ms | 3.4× |
| Throughput (benchmark) | 2,393 img/s | 3,239 img/s | 1.35× |
What we learn.
- The freeze scales with the batch size. Section 8.4 guessed that the freeze is the release of the shared-memory batch. A 4× smaller batch gives a 3.5× shorter freeze, which fits that guess. The trace still cannot show the release itself.
- The workers do less work too. They no longer convert to float or normalise, and they write a quarter of the bytes. End-to-end throughput rises from 2,393 to 3,239 images/s, but dividing those rates by eight does not independently measure worker capacity or prove linear scaling.
- The stalls still tend to come every 8 steps. In the benchmark, 41 of the 300 steps wait more than 5 ms, and 34 of the 40 intervals between them are exactly 8 steps. The dominant interval equals
num_workersin this run. That is consistent with worker scheduling and prefetch behavior, but does not establish that all workers produce synchronized waves; ordered delivery can also expose waits for a particular worker’s batch. - Normalising on the GPU is almost free. It takes 0.24 ms per step.
Long loader waits remain, so the next test increases worker count and prefetch depth together. These measurements do not establish a minimum worker count for reaching the input-free reference throughput.
9.4 More workers and a deeper prefetch queue
 food_loader = DataLoader(
     ...
-    num_workers=8,
+    num_workers=32,
+    prefetch_factor=4,
     ...
 )
The machine has 256 CPU cores, so 32 workers fit easily. prefetch_factor=4 lets each worker hold up to 4 batches, so up to 128 batches (about 2.4 GB of uint8 pixels) can be ready before they are needed. More workers and more batches use more host memory; check that before copying these numbers.
Events from step 10 (ts omitted):
{"cat": "user_annotation", "name": "data_load", "dur": 242}
{"cat": "cpu_op", "name": "aten::to", "dur": 441, "args": {"Input Dims": [[128, 3, 224, 224]], "Input type": ["unsigned char"]}}
{"cat": "python_function", "name": "<built-in method pin_memory of Tensor object at ...>", "dur": 7640}
{"cat": "python_function", "name": "<built-in method pin_memory of Tensor object at ...>", "dur": 9270}
{"cat": "python_function", "name": "multiprocessing/queues.py(98): get", "dur": 1344}
The main thread gets its batch in 0.24 ms. The pin-memory thread pins two batches in this step, and its wait on the worker queue is only 1.3 ms, because a batch is almost always ready. In Section 8 the same get took up to 121 ms.
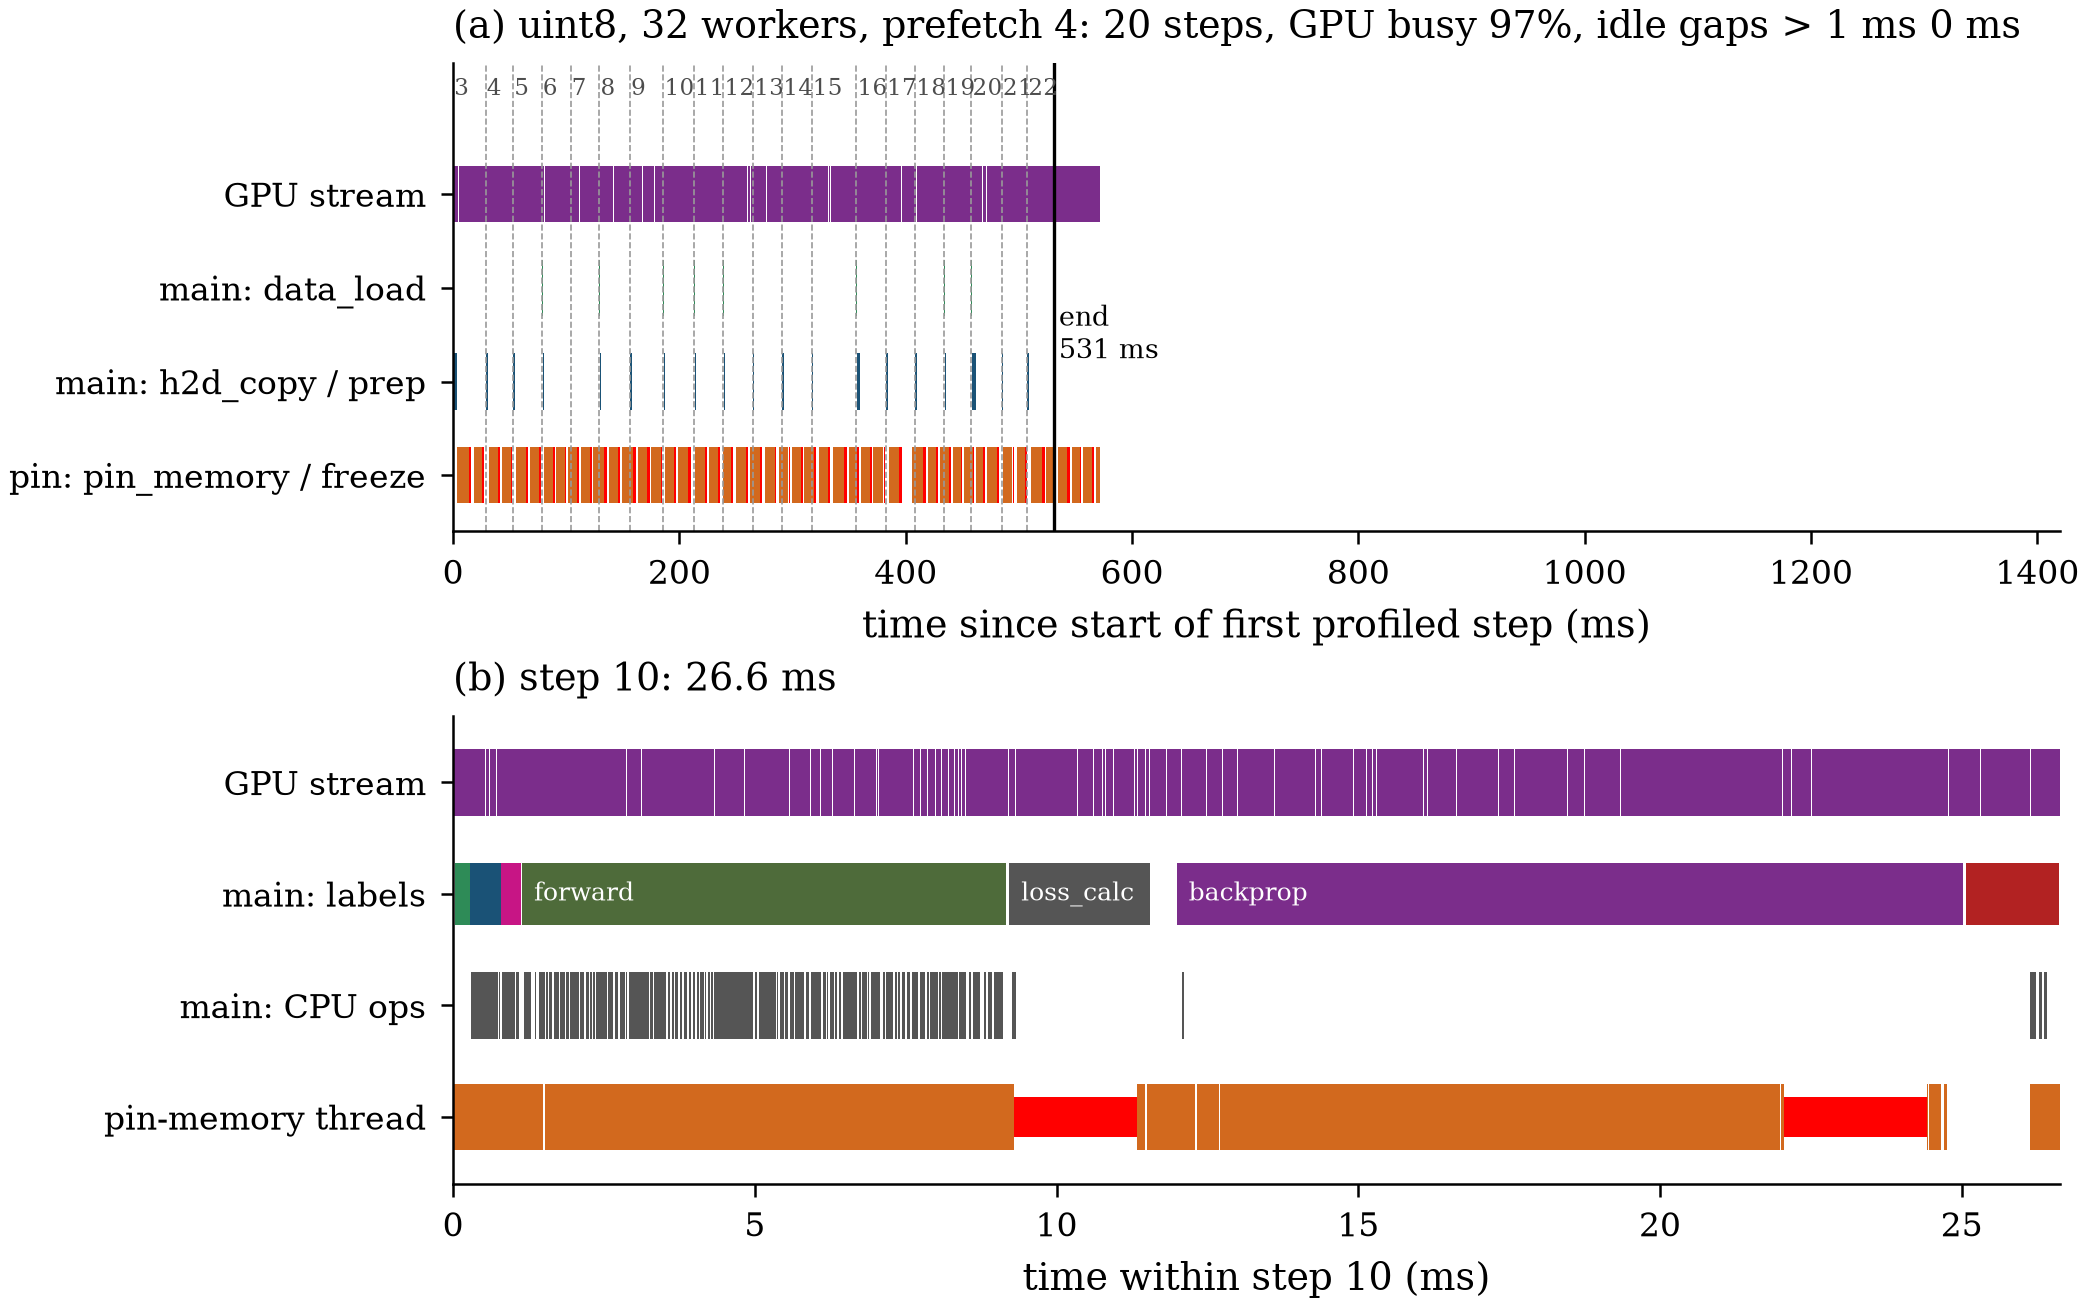
Figure 11. uint8 batches, 32 workers, prefetch_factor=4. (a) No GPU idle gap over 1 ms in 20 steps; 531 ms in total, the same as the synthetic run (521 ms). The pin-memory thread works almost all the time, filling the deeper queue, and its freezes (red) are still there. (b) Step 10, 26.6 ms. Two freezes (red), one during loss_calc and one during backprop, about 2 ms each. The GPU keeps running queued work through both.
The benchmark gives 4,666 images/s, 97% of the input-free reference throughput, at 27.4 ms per step against 26.7 ms. Over 300 steps the main thread waits 38 ms in total for batches, and no wait is longer than 3.1 ms. This is the combined effect of more workers and deeper prefetching, not a worker-count-only result.
Do the freezes still matter? The trace has 46 freezes in 20 steps, mean 1.75 ms. There are more freezes than steps because the pin-memory thread is still filling the queue of 128 batches. None coincides with a GPU idle gap: the main thread records no activity during these intervals as before, but the GPU has enough queued work to cover them.
Is the uint8 change still needed with 32 workers? A control run uses float32 batches with the same 32 workers and prefetch_factor=4:
-    transforms.PILToTensor(),
+    transforms.ToTensor(),
+    transforms.Normalize([0.485, 0.456, 0.406], [0.229, 0.224, 0.225]),
It reaches 4,328 images/s, 90% of the input-free reference throughput. The input stalls are gone here too; the larger batches are associated with longer pinning intervals, silent intervals and copies:
{"cat": "python_function", "name": "<built-in method pin_memory of Tensor object at 0x77d2a13dead0>",
 "tid": 3693108, "ts": ...241745.807, "dur": 27880.792}
{"cat": "python_function", "name": "<built-in method pin_memory of Tensor object at 0x77d2a13dead0>",
 "tid": 3693108, "ts": ...269638.197, "dur": 64.965}
{"cat": "kernel", "name": "cutlass3x_sm100_tensorop_s256x128x8tf32implicit_gemm_wgrad_f32_f32_f32",
 "tid": 7, "ts": ...269715.727, "dur": 49.856}
{"cat": "python_function", "name": "threading.py(601): is_set",
 "tid": 3693108, "ts": ...276208.201, "dur": 1.095}
{"cat": "kernel", "name": "void at::native::vectorized_elementwise_kernel<4, at::native::BinaryFu...",
 "tid": 7, "ts": ...276363.551, "dur": 7.872}
The labels finish pinning at ...269703. The GPU finishes its last queued kernel 62 µs later and then gets nothing new. The pin-memory thread records is_set() at ...276208, after a 6.5 ms freeze, and the next kernel starts 155 µs after that. For 6.6 ms, in the middle of backprop, the GPU waits for new host launches.
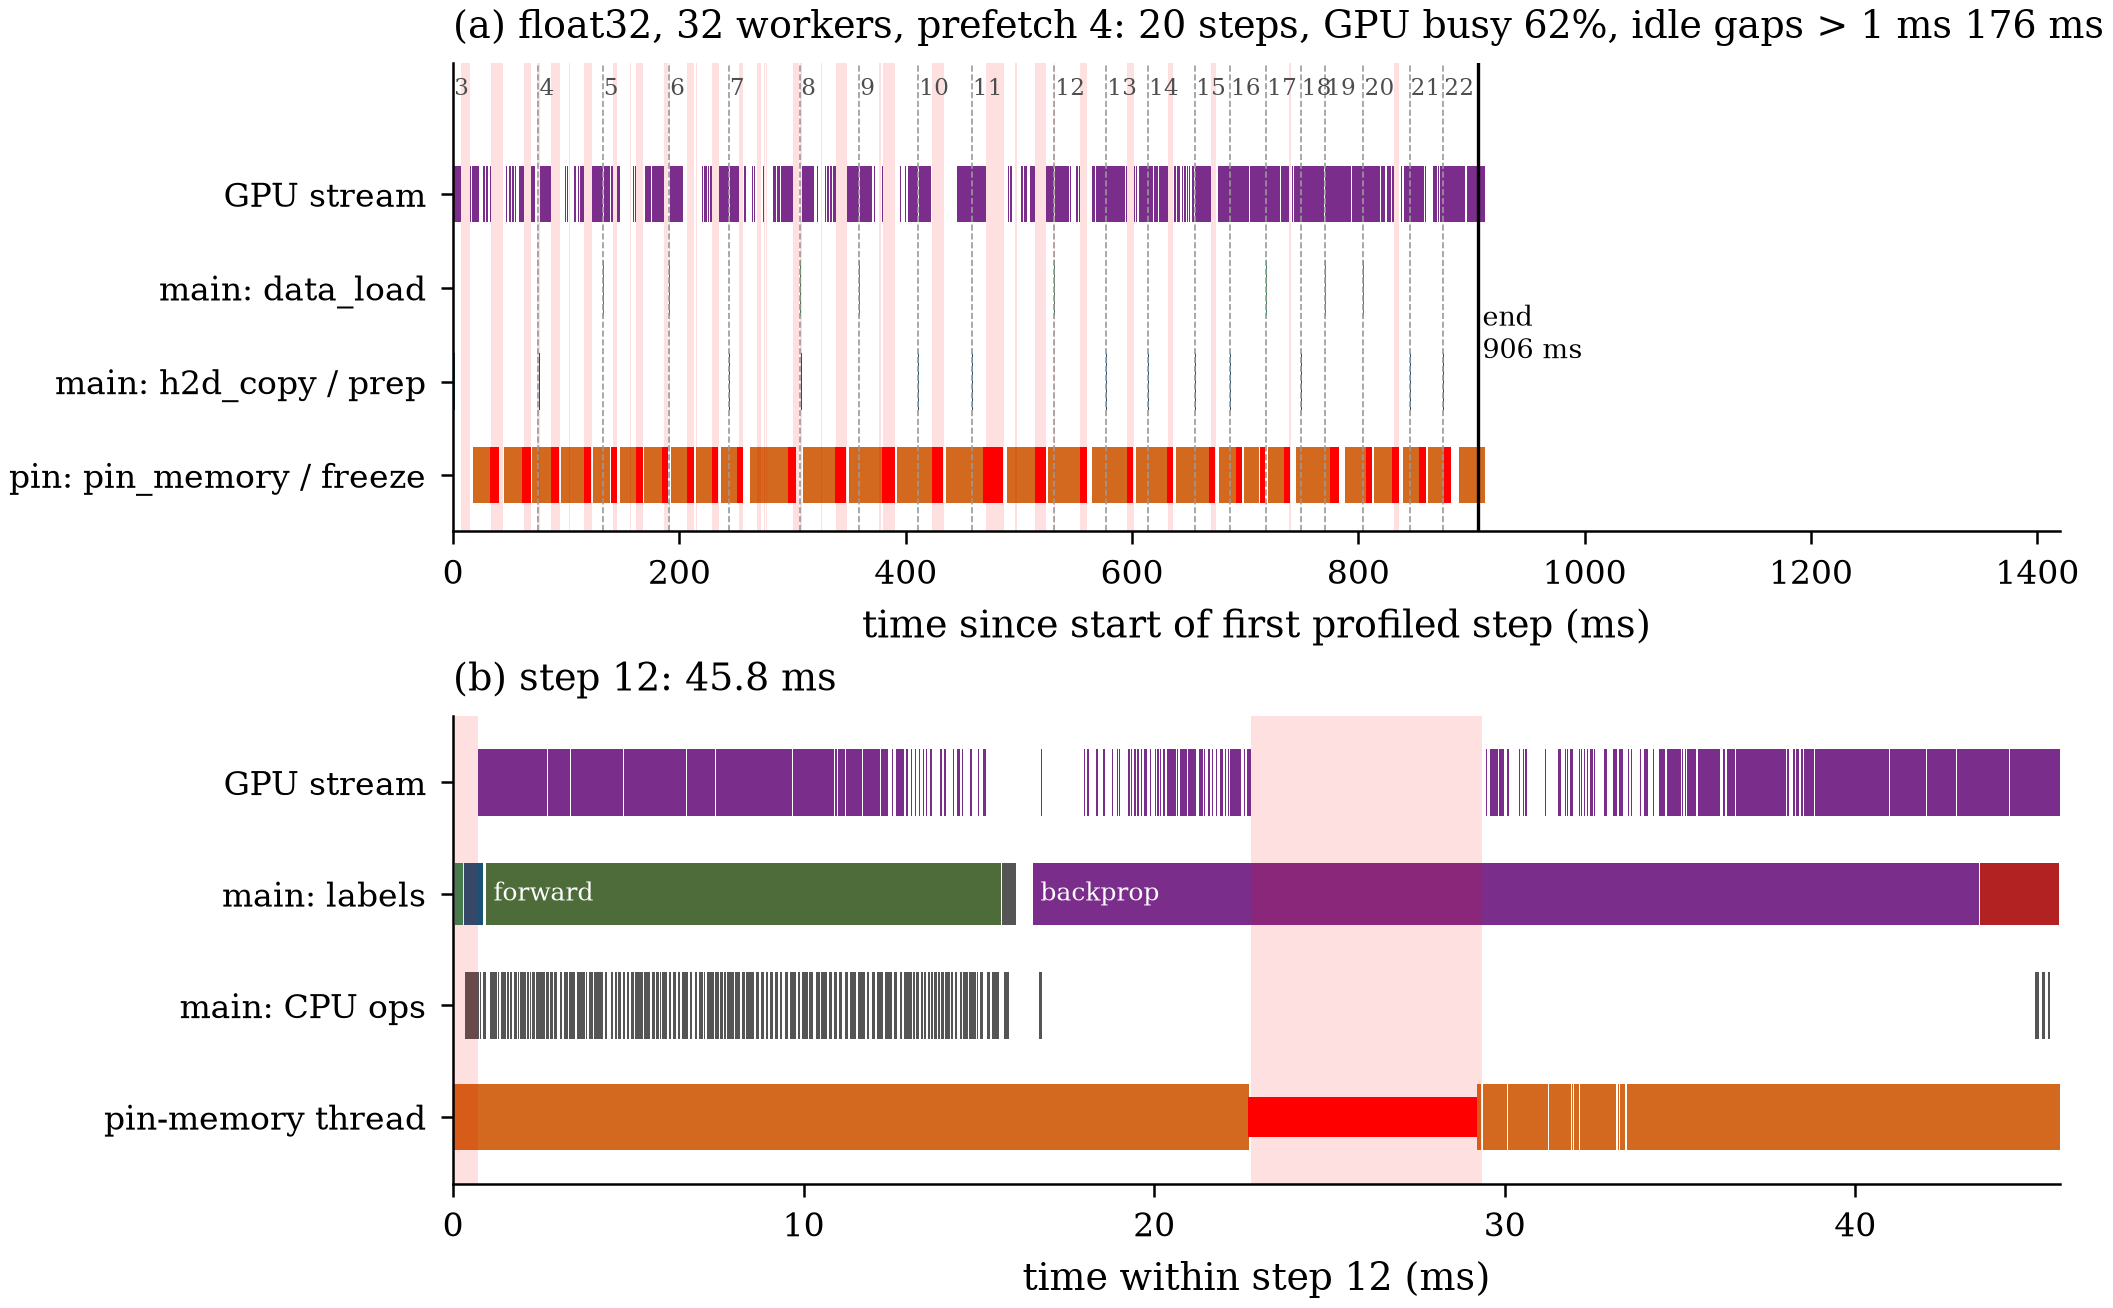
Figure 12. Control: float32 batches with 32 workers and prefetch_factor=4. (a) No long data_load stalls, but many short idle bands, one near each freeze. The pin-memory thread pins without pause. (b) Step 12. The freeze (red, 23–29 ms) lines up with a 6.6 ms GPU gap inside backprop.
Section 8.4 said a freeze costs GPU time only if the GPU queue is shorter than the freeze. Figure 12b illustrates that overlap. In the benchmark the float32 run is 2.2 ms per step slower than the uint8 run. In the profiles, the GPU copy is about 1.3 ms longer (1.9 ms against 0.6 ms), and silent host intervals coincide with GPU gaps. These observations suggest contributors, but subtracting profiled times from the unprofiled difference cannot assign the remainder to freezes. More workers with deeper prefetching remove the long stalls in these runs, and uint8 reduces the remaining per-batch cost.
9.5 Decode on the GPU
The last idea from Section 8.4 moves decoding and augmentation off the workers altogether. This run uses torchvision.io.decode_jpeg(device="cuda"), which uses nvJPEG; Section 9.6 tries DALI. The workers now only read the JPEG files. The main thread decodes them on the GPU and applies the crop and flip there:
-food_train = datasets.Food101(root="data", split="train", transform=food_tf)
+class JpegBytes(Dataset):
+    def __init__(self, base):
+        self.files, self.labels = base._image_files, base._labels
+    def __len__(self):
+        return len(self.files)
+    def __getitem__(self, i):
+        return read_file(str(self.files[i])), self.labels[i]
+
+def collate_bytes(batch):
+    sizes = torch.tensor([len(x) for x, _ in batch])
+    return (torch.cat([x for x, _ in batch]), sizes), torch.tensor([y for _, y in batch])
+
+def gpu_augment(packed, device):
+    flat, sizes = packed
+    images = decode_jpeg(list(flat.split(sizes.tolist())), mode=ImageReadMode.RGB, device=device)
+    out = []
+    for img in images:
+        top, left, h, w = transforms.RandomResizedCrop.get_params(img, (0.08, 1.0), (3 / 4, 4 / 3))
+        img = TF.resized_crop(img, top, left, h, w, [224, 224], antialias=True)
+        out.append(img.flip(-1) if torch.rand(1).item() < 0.5 else img)
+    return torch.stack(out)
+
+food_train = JpegBytes(datasets.Food101(root="data", split="train"))
 food_loader = DataLoader(
-    food_train, ..., pin_memory=True, ...
+    food_train, ..., pin_memory=False, prefetch_factor=4, collate_fn=collate_bytes, ...
 )
 ...
 with record_function("h2d_copy"):
-    images = images.to(device, non_blocking=True)
+    images = gpu_augment(images, device)
A first version returned a list of 128 separate byte tensors per batch. It failed after a few steps with OSError: [Errno 9] Bad file descriptor. Each tensor sent from a worker through shared memory is passed as its own file descriptor, so 128 tensors per batch, times 32 batches in flight, means thousands of open handles. Packing each batch into one flat tensor plus a tensor of sizes, as collate_bytes does, fixes it. Pinning is off, because a batch of compressed JPEGs is only a few megabytes.
One h2d_copy in step 10 (ts omitted):
{"cat": "user_annotation", "name": "data_load",                  "dur": 2950}
{"cat": "user_annotation", "name": "h2d_copy",                   "dur": 40510}
{"cat": "cpu_op",          "name": "image::decode_jpegs_cuda",   "dur": 9929}
Inside h2d_copy, decoding is about 10 ms. The rest is the per-image Python loop, including get_params, resized_crop and the flip decision. The trace records 709 cudaLaunchKernel calls, 129 small pageable copies and 1,052 aten::item scalar reads. Only reads from CUDA tensors imply GPU synchronization; the count alone does not establish how many synchronizations occurred. For example, torch.rand(1).item() in the code above reads a CPU tensor under the default device settings. In that 42 ms window the GPU runs 857 kernels that together take only 5.6 ms.
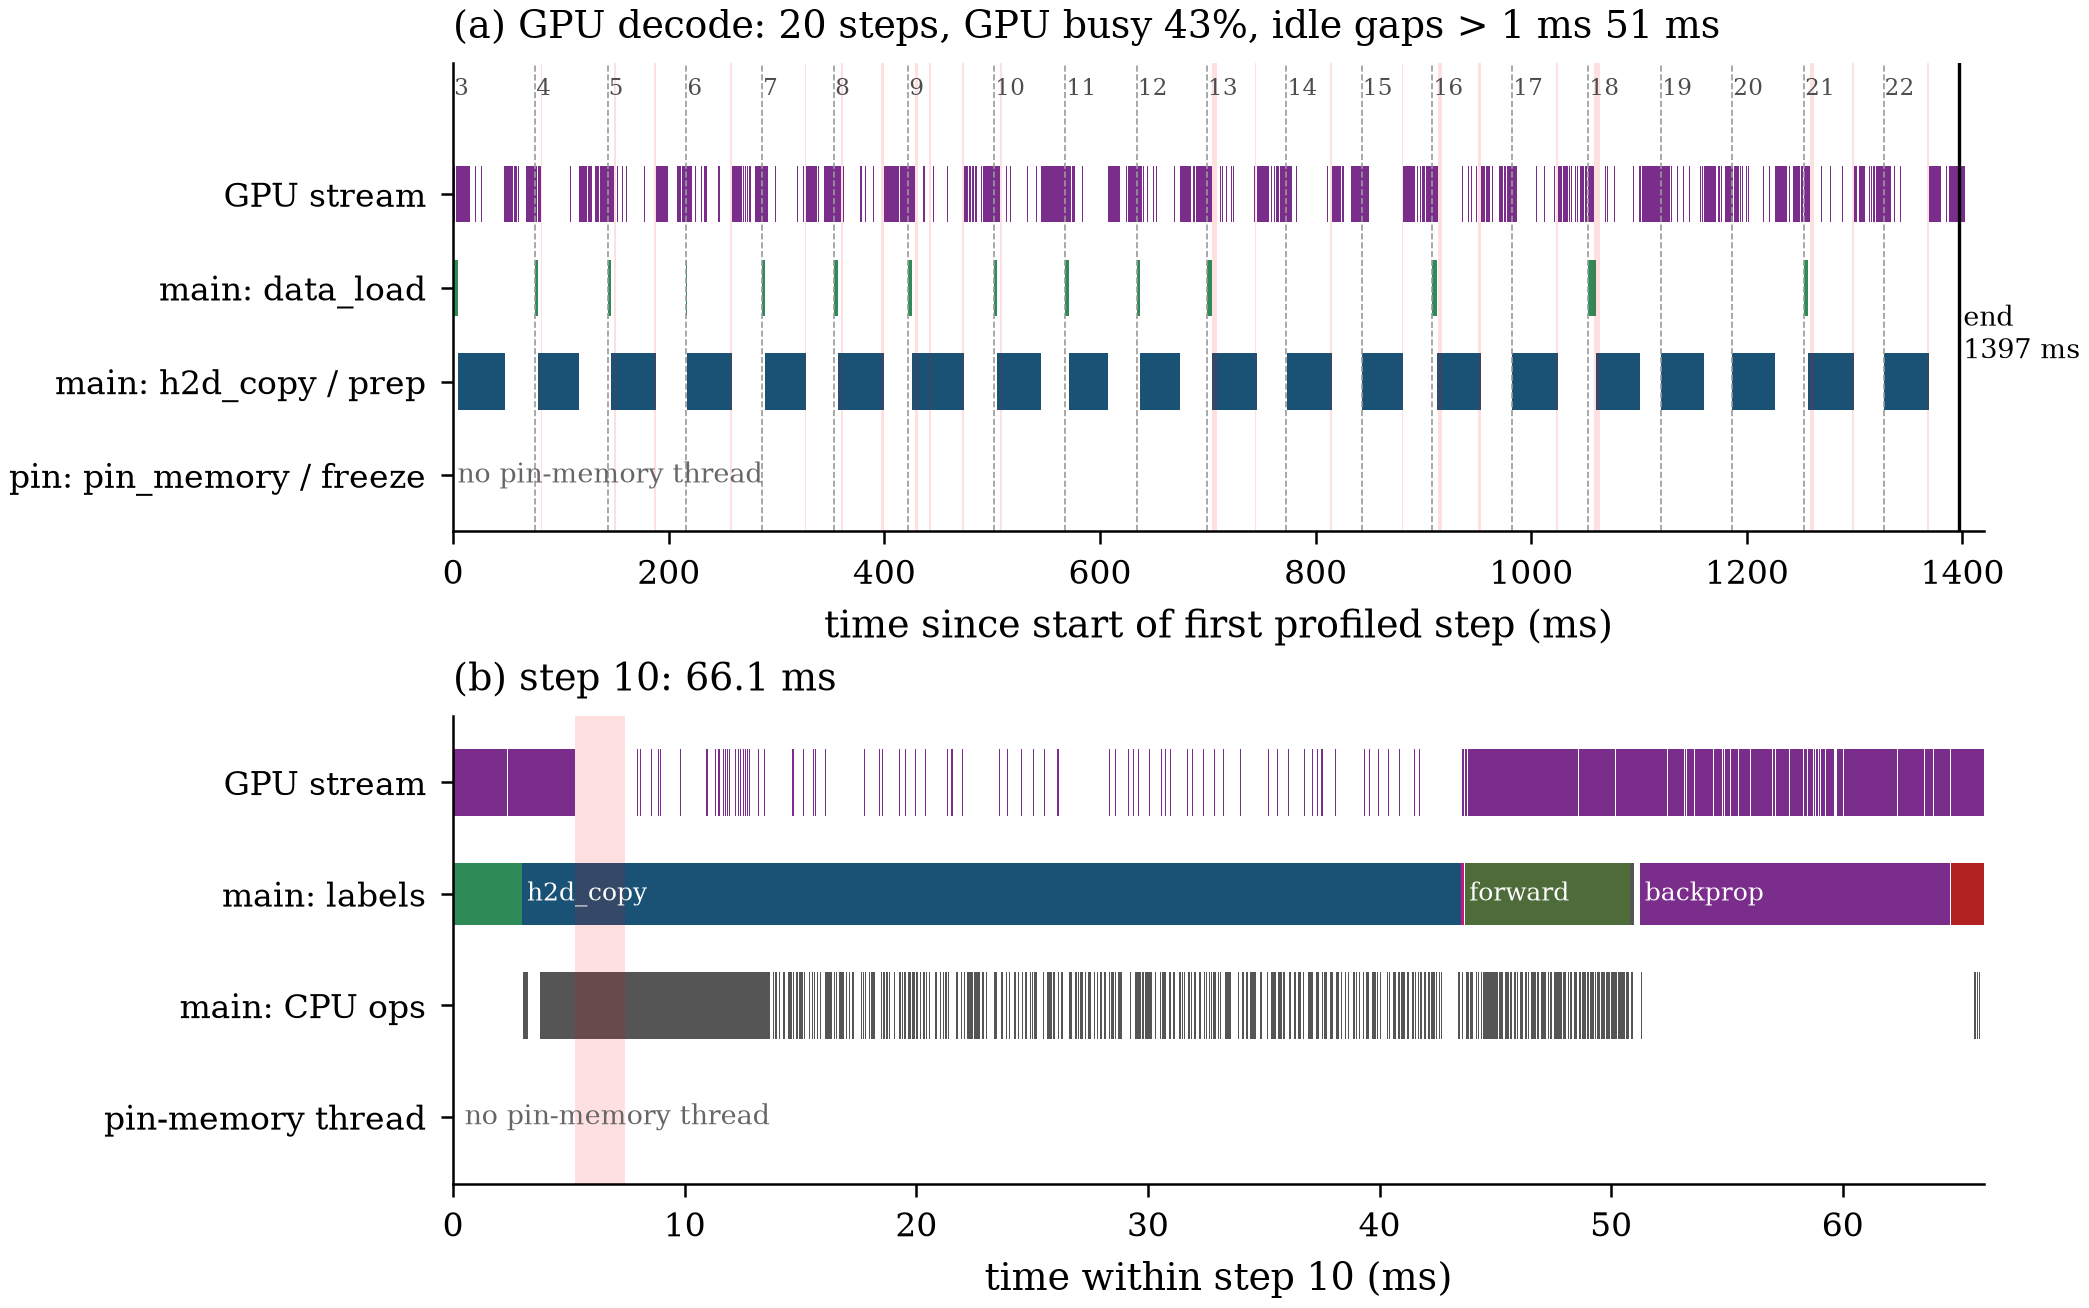
Figure 13. GPU decode with torchvision.io.decode_jpeg, 8 workers. (a) data_load is short, but every step is long; 20 steps take 1,397 ms and the GPU is busy 43% of the time. Most idle time is in many gaps shorter than 1 ms, so few bands are shaded. (b) Step 10. h2d_copy (decode plus per-image crop) takes 40 ms of the 66 ms step on the main thread. After finishing the previous step, the GPU runs only scattered small kernels until forward starts.
The benchmark gives 3,113 images/s, 65% of the input-free reference throughput, at 41.1 ms per step. The loader is no longer the problem: the main thread waits only 2.3 ms per step on average, with no wait over 5 ms. The main thread is the problem now. It spends about 14 ms per step more than the synthetic run, decoding and cropping 128 images one at a time, and it is the same thread that must keep the GPU fed. With with_stack=True the Python loop is much slower, which is why the profiled steps average 70 ms instead of 41 ms.
What we learn. Moving work to the GPU helps only if the host side stays cheap. Here the decode itself is fast, but the per-image Python loop puts hundreds of small launches and scalar reads on the main thread. A batched crop-and-resize, DALI’s fused GPU pipeline, or running gpu_augment on a separate thread and CUDA stream might fix this. The next section tries DALI.
9.6 NVIDIA DALI
DALI (here nvidia-dali-cuda130 2.3.0) replaces both the Dataset and the DataLoader. It reads files on its own C++ threads, decodes with nvJPEG, and does the crop, resize, flip and normalisation as batched GPU kernels on its own CUDA streams. It hands the training loop a finished float32 batch that is already on the GPU. There are no worker processes, no pinning, and no per-image Python. num_threads=8 and prefetch_queue_depth=2 match the baseline’s 8 workers and default prefetch_factor=2:
-food_train = datasets.Food101(root="data", split="train", transform=food_tf)
-food_loader = DataLoader(food_train, batch_size=128, shuffle=True, num_workers=8, pin_memory=True, ...)
+base = datasets.Food101(root="data", split="train")
+
+@pipeline_def(batch_size=128, num_threads=8, device_id=0, prefetch_queue_depth=2)
+def food_pipe():
+    jpegs, labels = fn.readers.file(files=[str(f) for f in base._image_files], labels=base._labels,
+                                    random_shuffle=True, name="Reader")
+    images = fn.decoders.image_random_crop(jpegs, device="mixed", output_type=types.RGB,
+                                           random_area=[0.08, 1.0], random_aspect_ratio=[3 / 4, 4 / 3])
+    images = fn.resize(images, resize_x=224, resize_y=224, antialias=True)
+    images = fn.crop_mirror_normalize(images, dtype=types.FLOAT, output_layout="HWC",
+                                      mean=[0.485 * 255, 0.456 * 255, 0.406 * 255],
+                                      std=[0.229 * 255, 0.224 * 255, 0.225 * 255],
+                                      mirror=fn.random.coin_flip())
+    return images, labels.gpu()
+
+p = food_pipe(); p.build()
+dali_iter = DALIGenericIterator(p, ["images", "labels"], reader_name="Reader",
+                                last_batch_policy=LastBatchPolicy.DROP, auto_reset=True)
+
+def food_batches():
+    while True:
+        for (b,) in dali_iter:
+            yield b["images"].permute(0, 3, 1, 2), b["labels"].squeeze(1).long()
device="mixed" means the JPEG headers are parsed on the CPU and the pixels are decoded on the GPU. The HWC output, viewed as NCHW by permute, is already channels_last, so the .to(device, memory_format=torch.channels_last) in the training step does nothing. The training step itself is unchanged.
The benchmark gives 4,415 images/s, 92% of the input-free reference throughput, at 29.0 ms per step (repeat: 4,411). With 32 threads and a queue of 4 it gives about 4,420 images/s (mean of three runs: 4,490, 4,416 and 4,363), the same within noise, so DALI’s CPU threads are not the limit. The profile agrees: data_load takes 0.5 ms (median) on the main thread, and the kernels on the training stream add up to 519 ms over 20 steps, exactly as in the synthetic run. DALI’s own GPU work, 46 ms over 20 steps on 25 other streams, runs alongside.
Yet the training stream is busy only 87.6% of the time, against 96.7% for the synthetic run. The idle time is not in long gaps; gaps of 1 ms or more add up to only 1.2 ms. It is 52 ms of gaps between 10 µs and 1 ms. The launch calls on the main thread explain them. They take 164 ms over 20 steps, against 24 ms in the synthetic run, and six of them block for more than 1 ms. The longest, in step 15 (raw ts and dur in µs):
{"name": "cudaDeviceSynchronize",       "tid": 2061416768, "ts": 680106021978.7, "dur": 20734.8}
{"name": "cudaLaunchCooperativeKernel", "tid": 3696107,    "ts": 680106026889.9, "dur": 24106.1}
{"name": "cudaEventRecord",             "tid": 2030053696, "ts": 680106026892.0, "dur": 23785.5}
{"name": "cudaMemcpyAsync",             "tid": 738199872,  "ts": 680106026954.5, "dur": 23768.3}
{"name": "cudaMemcpyAsync",             "tid": 763377984,  "ts": 680106026996.7, "dur": 23682.6}
Thread 3696107 is the main thread; launching one batch-norm kernel takes 24.1 ms. In the same window, 11 threads, the main thread included, are stuck in CUDA calls that normally take microseconds. They start within 0.2 ms of each other and end together. One DALI thread has been inside cudaDeviceSynchronize, which waits for the whole GPU, since 4.9 ms before. In five of the six long blocks, the block ends within 0.15 ms of the moment the training stream runs out of queued work; in the sixth, 1.2 ms after. This suggests that something in the process waits for the GPU to go idle, and every CUDA call from every thread waits behind it. The trace shows the effect but not the call that holds everything up; it happens below the CUDA runtime calls that the profiler records.
While the main thread is blocked, the GPU keeps running the work already queued, so the block itself costs little. The cost comes after: the queue is empty, and the GPU waits on each new launch until the main thread gets ahead again.
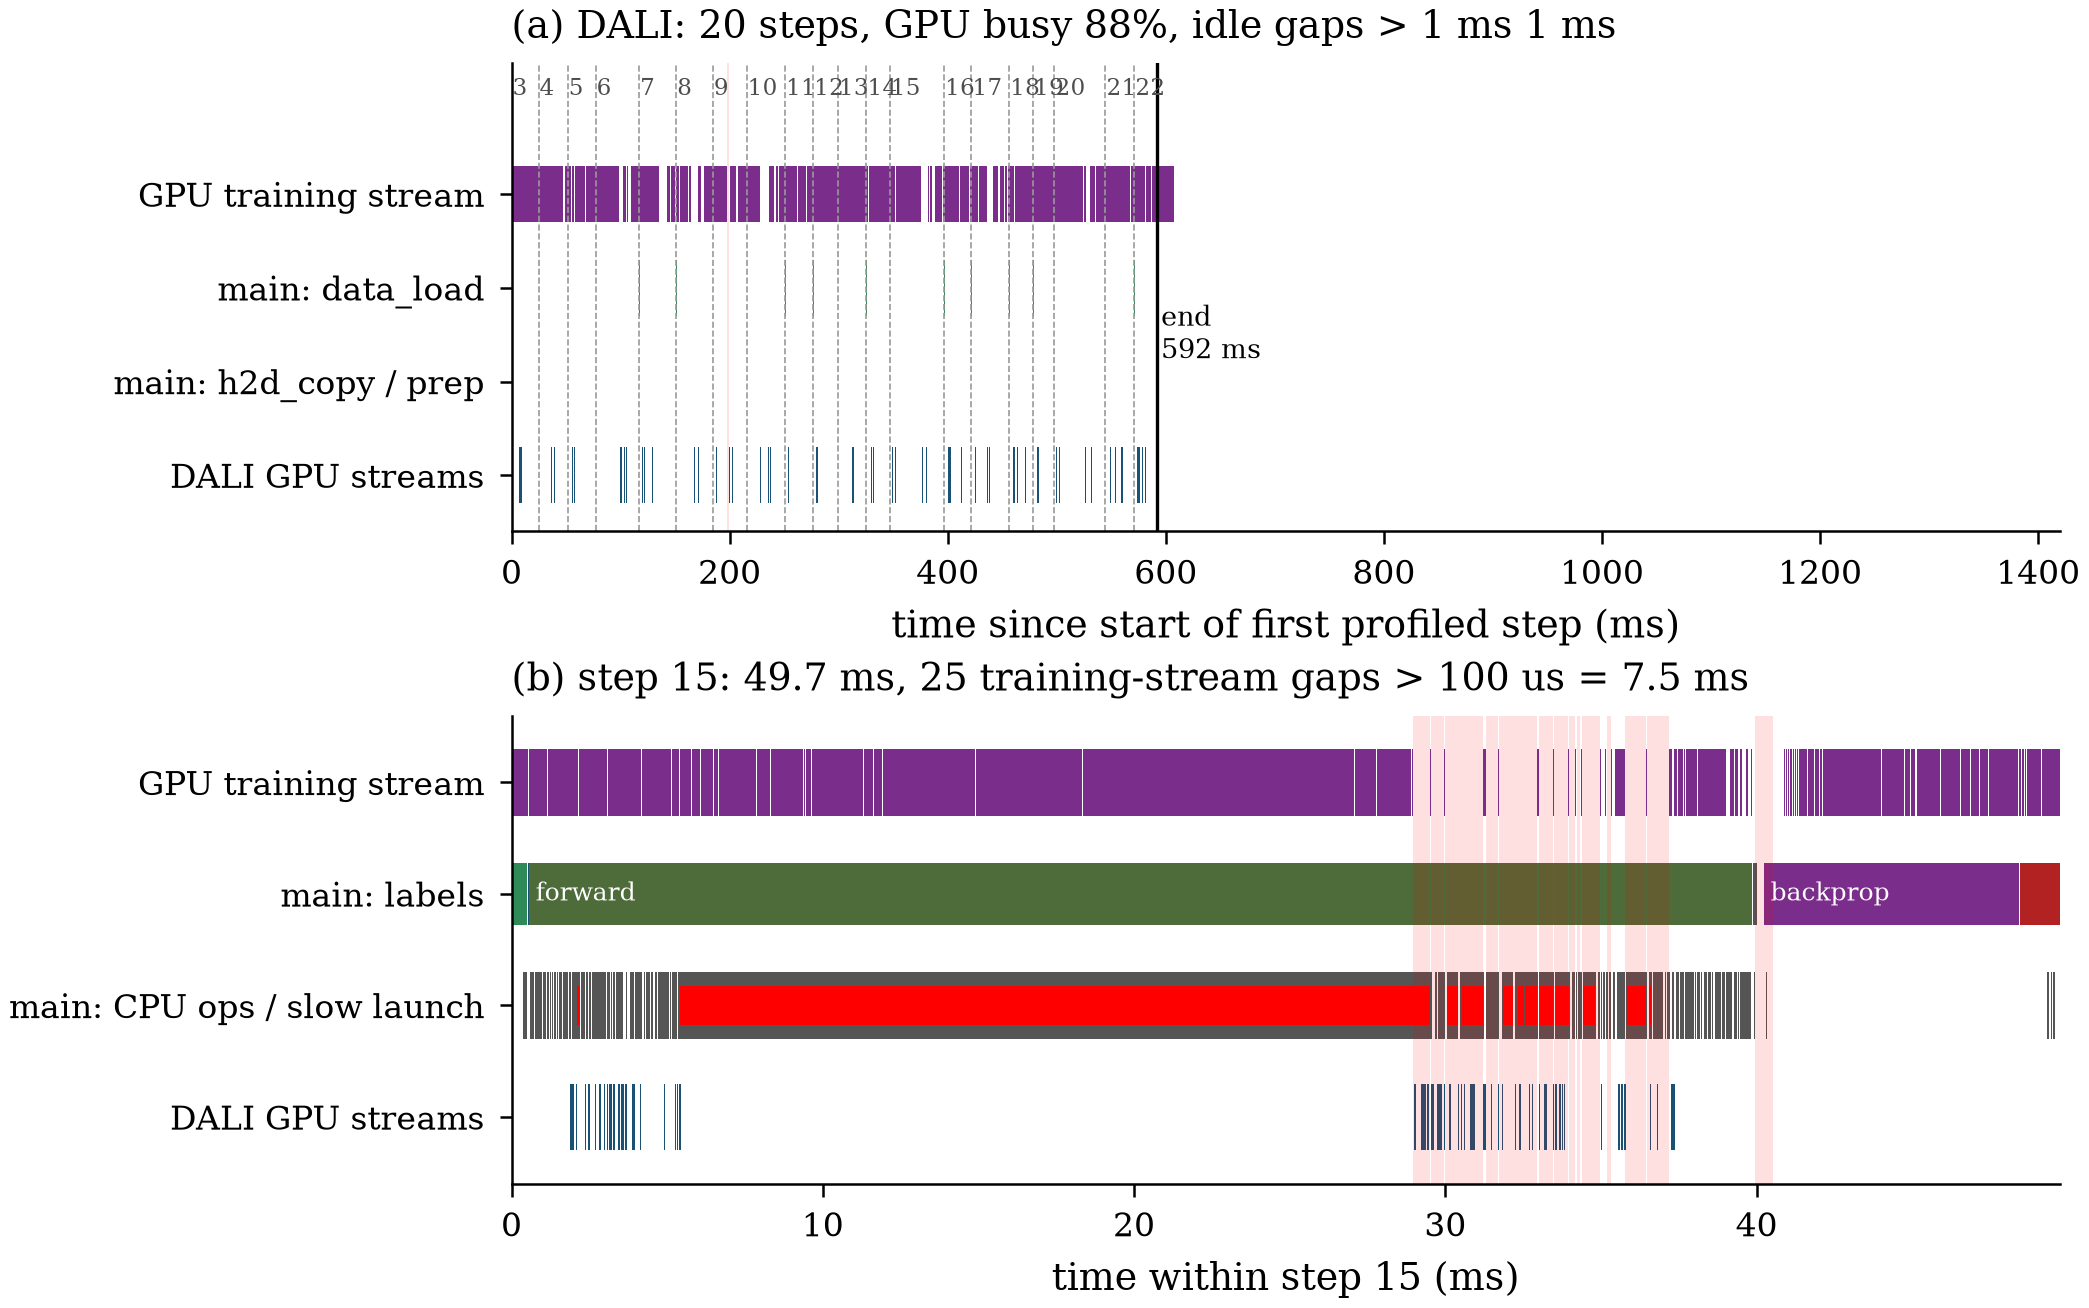
Figure 14. DALI, 8 threads. Lane 0 is the training stream; the bottom lane is DALI’s GPU work on its other streams. (a) No long data_load stalls and only 1.2 ms of idle bands over 1 ms, but the step lengths vary widely, from 20 to 50 ms. (b) Step 15, 49.7 ms. The launch in red blocks the main thread for 24 ms during forward. The GPU finishes its queue during that time, and once the block ends, it waits on the main thread; 25 gaps over 100 µs add up to 7.5 ms.
DALI’s hardware-decoder path is the first suspect, because it is the part of this run that no other run has. image_random_crop sends part of the images to the GPU’s dedicated JPEG decoder (hw_decoder_load=0.65 by default), and that path uses 14 extra streams with small host-to-device copies. To test it, send every image to nvJPEG’s CUDA path instead:
 images = fn.decoders.image_random_crop(jpegs, device="mixed", output_type=types.RGB,
-                                       random_area=[0.08, 1.0], random_aspect_ratio=[3 / 4, 4 / 3])
+                                       random_area=[0.08, 1.0], random_aspect_ratio=[3 / 4, 4 / 3],
+                                       hw_decoder_load=0.0)
The benchmark gives 4,696 images/s, 98% of the input-free reference throughput, at 27.3 ms per step (repeat: 4,688). This is effectively tied with the uint8, 32-worker configuration at 97%; the reported measurements do not establish a meaningful winner. The longest launch on the main thread is now 0.48 ms:
{"name": "cudaLaunchKernel", "tid": 3698427, "ts": 680480936830.9, "dur": 479.4}
The training stream is busy 94.9% of the time, and gaps over 10 µs add up to 7.2 ms instead of 53 ms. DALI now runs 70 ms of GPU work over 20 steps instead of 46 ms, because decoding uses the GPU’s compute units instead of the decoder engine, but that work overlaps training. DALI still calls cudaDeviceSynchronize 30 times in 20 steps (25 with the hardware decoder), so that call alone does not cause the long blocks. Launches on the main thread are still slower than in the synthetic run (137 ms against 24 ms in total; red marks in Figure 15b), but none of them is long enough to drain the GPU queue.
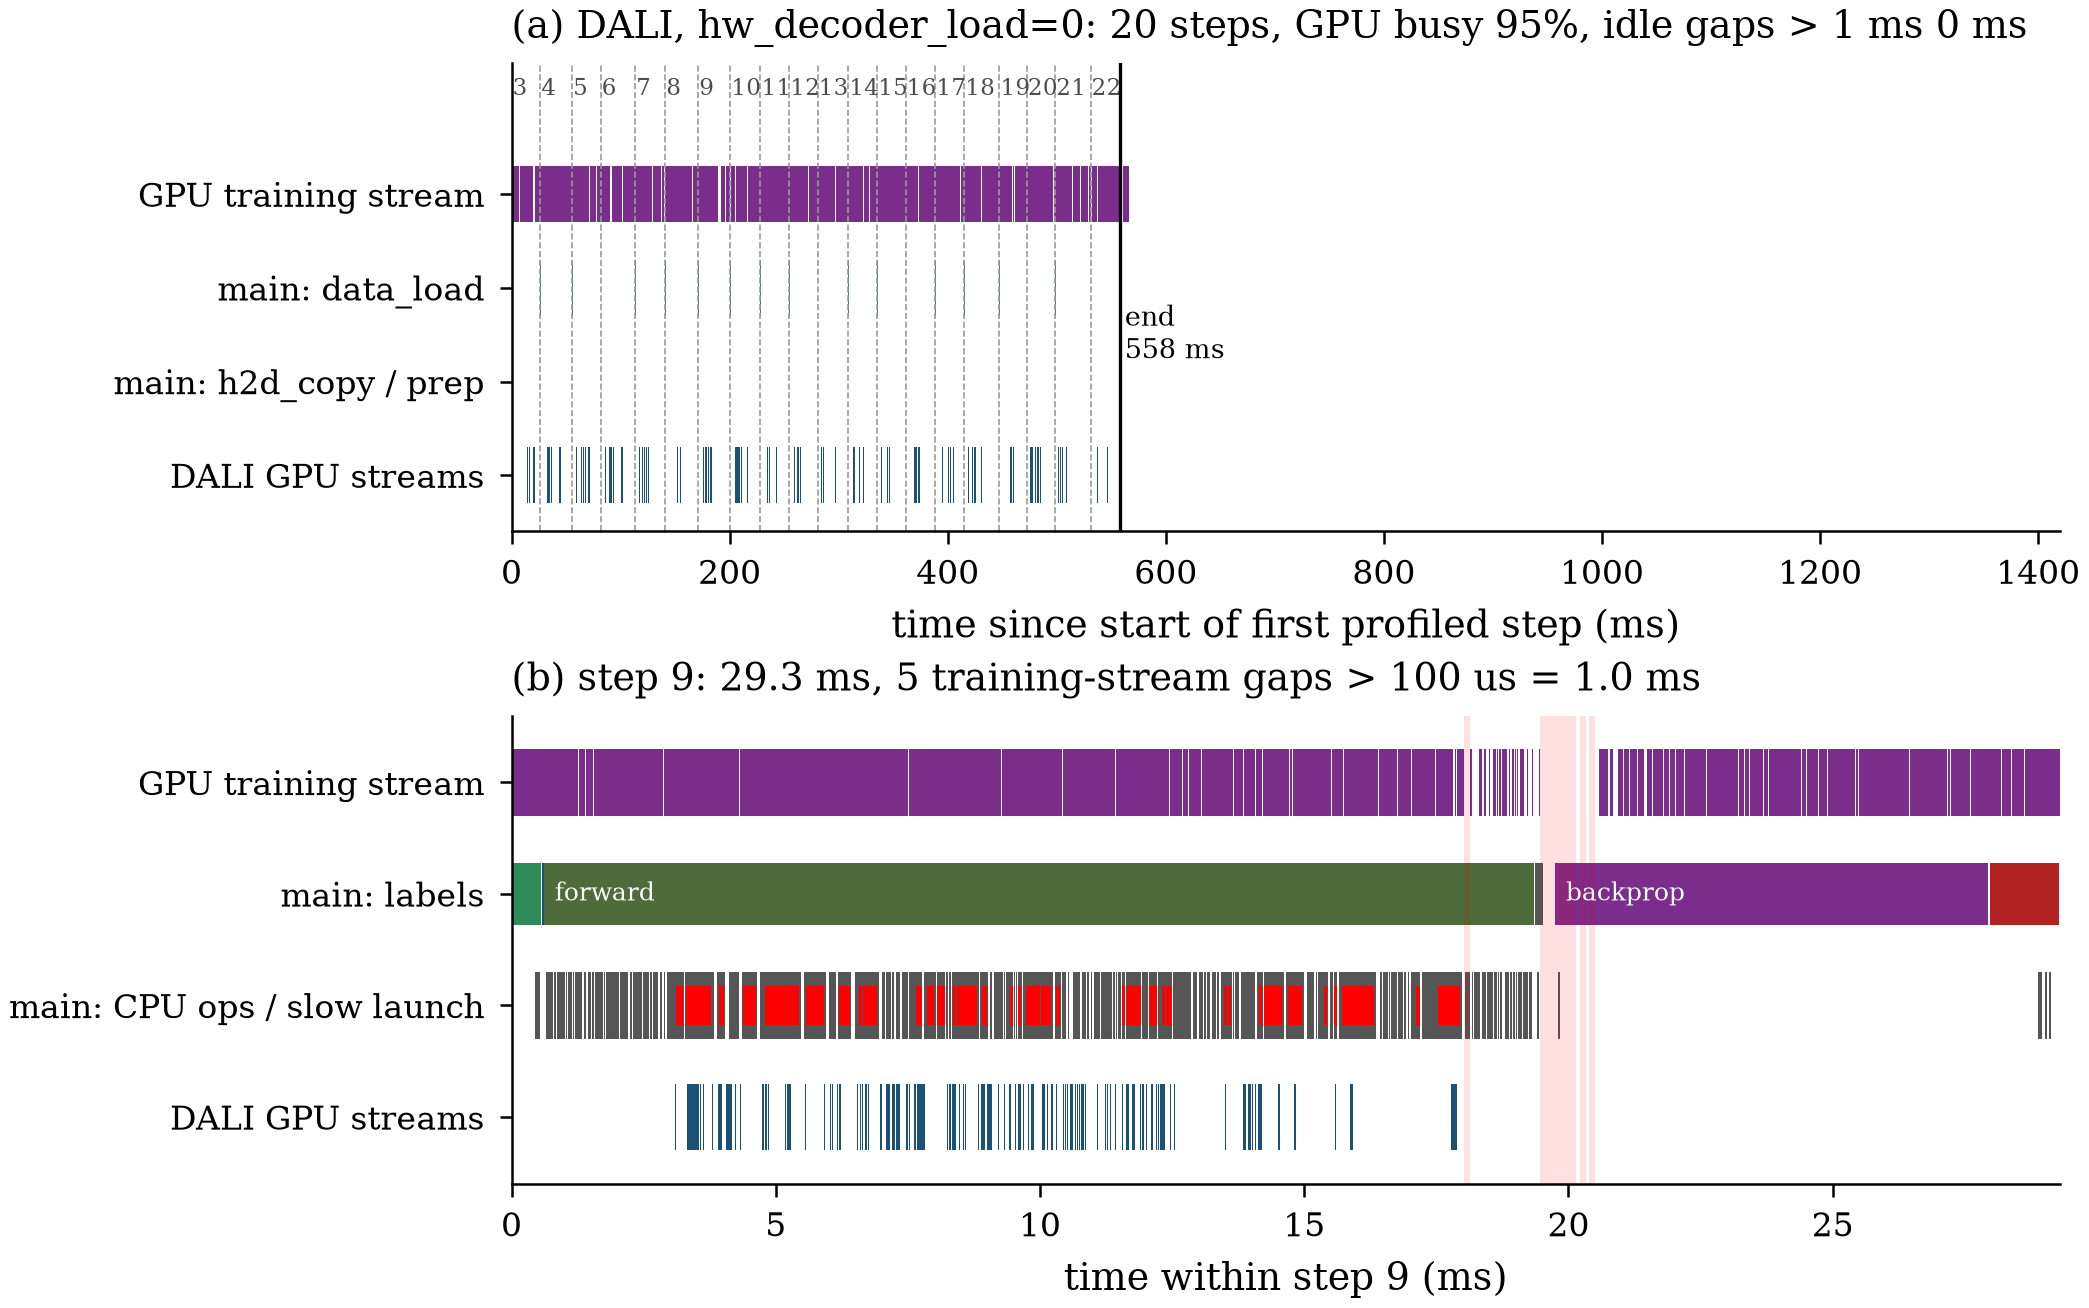
Figure 15. DALI with hw_decoder_load=0. (a) The training stream is busy 95% of the time, and the steps are even, 25–32 ms. (b) Step 9, 29.3 ms, the slowest step. Launches still slow down while DALI’s kernels run (red), but the GPU queue never empties for long; 5 gaps over 100 µs add up to 1.0 ms.
What we learn. DALI fixes the problem from Section 9.5: the per-image work runs on DALI’s C++ threads and in batched kernels, not on the main thread, and 8 threads are enough. But a loader that shares the GPU and the process with training can hurt in a new way: its CUDA calls can block the training thread’s launches. On the GPU stream this looks like many short gaps, with no obvious cause. The cause shows up only in the CUDA runtime calls on the CPU threads, where every thread is blocked at the same time. Here the fix was to turn off a hardware feature, which is not a general rule. On another GPU, driver or DALI version, or when the GPU’s compute units are the bottleneck, the hardware decoder may win. Measure both.
9.7 Comparing the runs
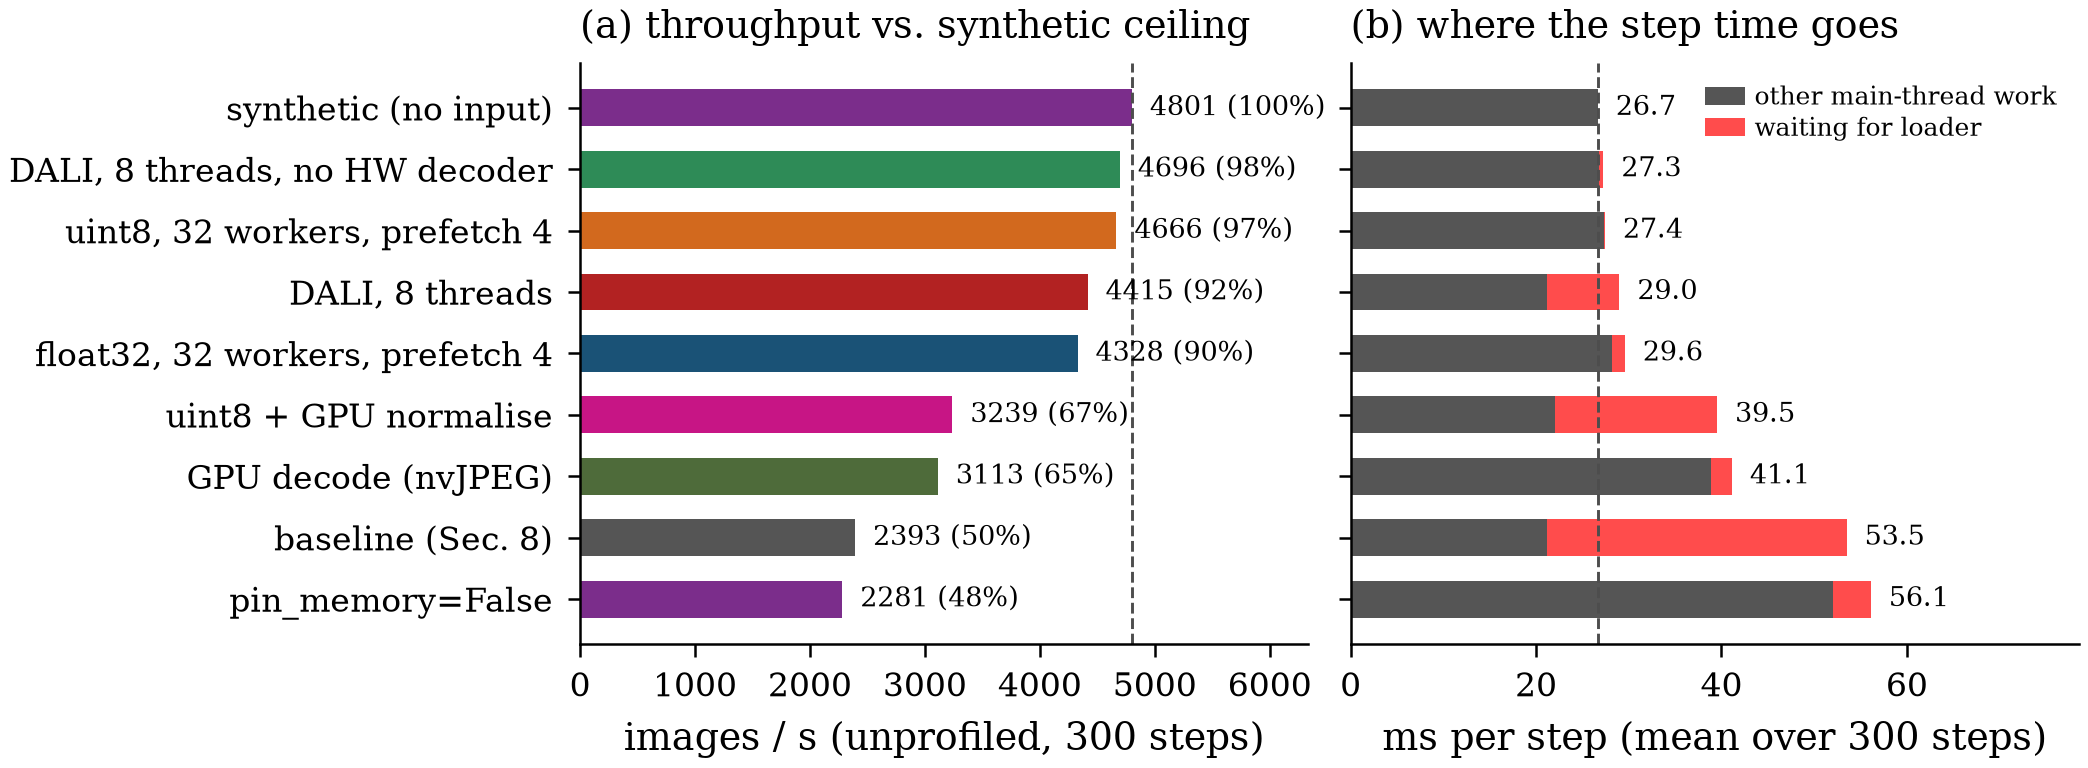
Figure 16. All runs, from the 300-step benchmark without the profiler. (a) Images per second, with the percentage of the input-free reference throughput; the dashed line is that reference (labelled “ceiling” in the plot). (b) Mean time per step, split into waiting for next(batches) (red) and everything else on the main thread (grey); the dashed line is the synthetic step time, 26.7 ms.
| Run | img/s | % of input-free reference | ms/step | loader wait per step | Profiled GPU busy | Freeze (mean) |
|---|---|---|---|---|---|---|
| synthetic (no input) | 4,801 | 100% | 26.7 | 0.0 ms | 96.7% | — |
| DALI, 8 threads, no HW decoder | 4,696 | 98% | 27.3 | 0.4 ms | 94.9%* | — |
| uint8, 32 workers, prefetch 4 | 4,666 | 97% | 27.4 | 0.1 ms | 96.7% | 1.8 ms |
| DALI, 8 threads | 4,415 | 92% | 29.0 | 7.8 ms | 87.6%* | — |
| float32, 32 workers, prefetch 4 | 4,328 | 90% | 29.6 | 1.4 ms | 61.5% | 7.0 ms |
| uint8 + GPU normalise, 8 workers | 3,239 | 67% | 39.5 | 17.5 ms | 80.2% | 1.8 ms |
| GPU decode, 8 workers | 3,113 | 65% | 41.1 | 2.3 ms | 42.9% | — |
| baseline (Section 3) | 2,393 | 50% | 53.5 | 32.3 ms | 56.8% | 6.2 ms |
pin_memory=False, blocking transfer | 2,281 | 48% | 56.1 | 4.0 ms | 79.9% | — |
* Training stream only; DALI’s own streams are not counted.
Panel (b) of Figure 16 shows the result in one view. The baseline loses half of each step waiting for the loader. pin_memory=False and GPU decode remove the wait, but the work they move onto the main thread makes the grey bar longer by about as much. Only the runs that make the loader fast enough and keep the main thread light reach the dashed line. The red bar for DALI with 8 threads overstates its cost: next() blocks in the stalled CUDA calls of Section 9.6, mostly while the GPU still has queued work, so the step is only 2.3 ms longer than the synthetic one.
What we learn.
- Fix the largest gap first. The freezes were the first thing the 5-step profile showed, but the input stalls cost far more. With 8 workers, both float32 and
uint8runs still had long loader waits. With more workers and deeper prefetching, those waits disappeared and shorter pinning-associated gaps became visible in the float32 run (Figure 12). This does not establish an independent per-worker rate or linear worker scaling. - Watch which thread pays.
pin_memory=Falseand GPU decode each removed a cost from the loader and added it to the main thread, the one thread that must keep the GPU busy. The profiler shows this directly: the time moves fromdata_loadtoh2d_copy. DALI keeps the work off the main thread, but with the hardware decoder on, its CUDA calls still blocked the main thread’s launches. Check the CUDA runtime calls on the launching thread, not only the GPU stream. - Send fewer bytes.
uint8batches made every stage that touches the batch faster by about 3–4×, from the workers to the GPU copy, and moved one cheap operation to the GPU. - Measure against an input-free reference. The synthetic run provides a comparison for this training configuration. Without it, 3,239 images/s would look like a good result instead of 67% of the reference throughput. That percentage is not hardware utilization.
- Profile to explain, benchmark to score.
with_stack=Trueslows Python-heavy runs: 70 ms against 41 ms per step for GPU decode, 45 ms against 30 ms for float32 with 32 workers. Use the trace to find out why a run is slow, and the benchmark without the profiler to decide which run is faster.
Two settings come close to the input-free reference throughput. DALI with hw_decoder_load=0 trains at 4,696 images/s, 1.96× the baseline and 98% of the reference. uint8 batches normalised on the GPU, with 32 workers and prefetch_factor=4, train at 4,666 images/s, 1.95× the baseline and 97% of the reference. Treat them as effectively tied near 97–98%: the difference is within 1%, and these measurements do not establish a meaningful winner. DALI gets there with 8 threads instead of 32 worker processes.
10. Conclusion
torch.profiler helps answer “which part of my PyTorch code is responsible?” It integrates PyTorch operator attribution, optional source stacks, and CUDA activity in one trace. Use a schedule to skip warmup, label the phases you care about, and compare the CPU and device columns before drawing conclusions.
In this post, a 5 ms gap in one step led, through longer traces and input-configuration comparisons, to an input pipeline that ran at 50% of the input-free reference throughput. uint8 batches with 32 workers and deeper prefetching, and DALI with its hardware JPEG decoder turned off, were effectively tied near 97–98%. The key lesson is that short captures can hide large input stalls, while smaller host stalls matter only when queued GPU work runs out. Find where the GPU stream is idle, follow the last kernel back to see which side is waiting, and read every host thread in that window. Use isolated changes to test causes; use unprofiled benchmarks against the input-free reference to compare complete configurations.
The profiler showed overlapping silent intervals on host threads and CUDA calls blocking together, but it did not establish a lock or driver-wait mechanism. For OS scheduling and lower-level correlation, move to nsys; for why a kernel is slow, to ncu.
References
- PyTorch. torch.profiler. PyTorch documentation. https://docs.pytorch.org/docs/stable/profiler.html
- PyTorch. Understanding CUDA Memory Usage. PyTorch documentation. https://docs.pytorch.org/docs/stable/torch_cuda_memory.html
- PyTorch. Kineto. GitHub. https://github.com/pytorch/kineto
- K. He, X. Zhang, S. Ren, J. Sun. Deep Residual Learning for Image Recognition. CVPR 2016. https://arxiv.org/abs/1512.03385
Appendix A. Trace events behind Figure 6
Figure 6 is drawn from four kinds of events in the Section 3.4 trace:
- GPU lane: every
kernel,gpu_memcpyandgpu_memsetevent on stream7, merged into busy intervals. A hole of more than 1 ms between two intervals is shaded as a gap. - Main and autograd lanes: the
cpu_op,cuda_runtimeandcuda_driverevents on each thread, merged the same way. Theuser_annotationlabels are drawn in their own lane in panel (b). - Pin-memory lane: every event on the one remaining thread that makes CUDA runtime calls but launches no kernels.
- Steps: the
ProfilerStep#Nlabels give the step boundaries and the time origin.
The events below define panel (b), the step 7 gap. They are unchanged except that fields not used by the figure are dropped and the two kernel names are shortened. The comment on each line gives its start and end in ms from the start of step 7, the time axis of panel (b).
// [A1] 0.000–33.751  step boundary
{"ph": "X", "cat": "user_annotation", "name": "ProfilerStep#7",
 "pid": 3663150, "tid": 3663150, "ts": 669899299299.495, "dur": 33751.054}

// [A2] 0.694–21.217  forward label, still open during the stall
{"ph": "X", "cat": "user_annotation", "name": "forward",
 "pid": 3663150, "tid": 3663150, "ts": 669899299993.902, "dur": 20522.281}

// [A3] 15.045–15.050  pin-memory thread
{"ph": "X", "cat": "cuda_runtime", "name": "cudaPointerGetAttributes",
 "pid": 3663150, "tid": 456922816, "ts": 669899314344.973, "dur": 4.34}

// [A4] 15.077–15.090  pin-memory thread
{"ph": "X", "cat": "cuda_runtime", "name": "cudaEventQuery",
 "pid": 3663150, "tid": 456922816, "ts": 669899314376.7, "dur": 12.9}

// [A5] 15.091–15.189  last operator on the main thread before the stall
{"ph": "X", "cat": "cpu_op", "name": "aten::linear",
 "pid": 3663150, "tid": 3663150, "ts": 669899314390.006, "dur": 98.305,
 "args": {"External id": 40119, "Input Dims": [[128, 2048], [101, 2048], [101]]}}

// [A6] 15.106–15.188  fc layer inside A5
{"ph": "X", "cat": "cpu_op", "name": "aten::addmm",
 "pid": 3663150, "tid": 3663150, "ts": 669899314405.129, "dur": 82.354,
 "args": {"External id": 40123, "Input Dims": [[101], [128, 2048], [2048, 101], [], []]}}

// [A7] 15.176–15.184  last launch before the stall
{"ph": "X", "cat": "cuda_runtime", "name": "cudaLaunchKernelExC",
 "pid": 3663150, "tid": 3663150, "ts": 669899314475.8, "dur": 7.878,
 "args": {"External id": 40123, "correlation": 364099}}

// [A8] 16.598–16.601  last GPU work before the gap
{"ph": "X", "cat": "kernel", "name": "void cublasLt::splitKreduce_kernel<...>(...)",
 "pid": 0, "tid": 7, "ts": 669899315897.172, "dur": 3.136,
 "args": {"External id": 40123, "correlation": 364099, "stream": 7}}

// [A9] 21.065  the only main-thread event during the stall
{"ph": "i", "cat": "cpu_instant_event", "name": "[memory]",
 "pid": 3663150, "tid": 3663150, "ts": 669899320364.431,
 "args": {"Bytes": -51712, "Total Allocated": 11378450432}}

// [A10] 21.334–21.718  loss_calc label
{"ph": "X", "cat": "user_annotation", "name": "loss_calc",
 "pid": 3663150, "tid": 3663150, "ts": 669899320633.251, "dur": 383.997}

// [A11] 21.402–21.593  first operator on the main thread after the stall
{"ph": "X", "cat": "cpu_op", "name": "aten::cross_entropy_loss",
 "pid": 3663150, "tid": 3663150, "ts": 669899320701.167, "dur": 190.999,
 "args": {"External id": 40125}}

// [A12] 21.436–21.538  operator inside A11
{"ph": "X", "cat": "cpu_op", "name": "aten::_log_softmax",
 "pid": 3663150, "tid": 3663150, "ts": 669899320735.176, "dur": 102.054,
 "args": {"External id": 40128, "Input Dims": [[128, 101], [], []]}}

// [A13] 21.483–21.525  first launch after the stall
{"ph": "X", "cat": "cuda_runtime", "name": "cudaLaunchKernel",
 "pid": 3663150, "tid": 3663150, "ts": 669899320782.254, "dur": 42.588,
 "args": {"External id": 40128, "correlation": 364112}}

// [A14] 21.524–21.526  first GPU work after the gap
{"ph": "X", "cat": "kernel", "name": "void (anonymous namespace)::softmax_warp_forward<...>(...)",
 "pid": 0, "tid": 7, "ts": 669899320823.18, "dur": 1.92,
 "args": {"External id": 40128, "correlation": 364112, "stream": 7}}
How the numbers in Figure 6(b) and Section 7 come from these events:
- GPU idle 4.9 ms. From the end of A8 (16.601) to the start of A14 (21.524). No
kernel,gpu_memcpyorgpu_memsetevent on stream7falls in between. - Main thread idle 6.2 ms. From the end of A5 (15.189) to the start of A11 (21.402). The only main-thread event in between is the free in A9, an instant event with no duration, so the lane stays empty.
- The GPU waits on the host. A8 shares
External id40123 andcorrelation364099 with A6 and A7, so it is thefclayer’s last kernel. A14 shares 40128 and 364112 with A12 and A13. The GPU starts A14 0.04 ms after A13 is called: the work reaches the GPU as soon as the main thread issues it. forwardstays open. A2 ends at 21.217, 6 ms after its last operator (A5). The main thread is still insidemodel(images)during the stall.- Pin-memory thread. A3 and A4, plus one more
cudaEventQueryat 15.092–15.096, are its only events from 14.2 ms to the end of the stall. They fall just before and during A5, the main thread’s last operator. The autograd thread has no events in this window.