Abstract
The previous articles took the memory layout and the kernels as given and measured them in isolation. Between those two layers sits a component that decides what the GPU is actually asked to do: the request scheduler. This article follows a request through it — arrival, admission to a batch, prefill, decode steps, and eviction under memory pressure — and shows why iteration-level scheduling replaced the static batching that came before. It works out where tail latency comes from, why the memory bound and the throughput bound are different constraints, and why a scheduler cannot simply run everything that fits. Unlike the surrounding articles, this one has no profile of the scheduler itself; the measured figures it cites are the ones that constrain the design, and they are labelled as such.
1. The layer nobody benchmarks
Six articles in this series have looked at what one attention call costs. All of them measured the same way: build a tensor, time the kernel, report the ratio. That is the right way to isolate a kernel and the wrong way to describe a server, because a server does not execute attention calls. It executes a sequence of decisions about which requests to run together, and those decisions set the shape of every call that follows.
The gap is easy to see in the numbers already established. PagedAttention showed that a paged allocator admits thousands of concurrent requests where a conservative one admits three. The KV cache article showed that decode at batch 1 reaches 23% of HBM bandwidth and at batch 32 reaches 75%. Neither result is a property of a kernel. Both are statements about how many requests are in flight — which is exactly what the scheduler controls.
So the question this article answers is: given requests arriving at unpredictable times with unpredictable lengths, what should the GPU be doing at any instant?
2. Why static batching fails
The obvious scheme, inherited from training, is to collect requests, run them as a batch until all finish, then start the next batch. It has one property that ruins it: the batch runs until its longest member finishes.
static batching -- the batch is held open by its slowest request

  time  --------------------------------------------->

  req A  [prefill][dec][dec]
  req B  [prefill][dec][dec][dec][dec][dec][dec][dec][dec][dec][dec]
  req C  [prefill][dec]
  req D  [prefill][dec][dec][dec][dec]
         |                                                  |
         batch admitted                                 batch closes
         |<----------------- A, C, D idle here ------------>|
A, C, and D each finished long before the batch closed, and their slots sat reserved but unused for the remainder. The cost is not only wasted capacity: every decode step in that window is also slower for B, because the GPU is doing the same work with fewer useful rows.
Two separate wastes compound. Memory is reserved for requests that will not use it again, which is precisely the fragmentation PagedAttention was built to remove — but paging fixes the allocator, not the policy. Latency for the finished requests is unaffected — they are simply done — while latency for newly arriving requests is terrible, because they cannot start until the whole batch drains.
3. Iteration-level scheduling
The fix, introduced as continuous or iteration-level batching, is to make the scheduling decision once per decode step rather than once per batch. At the end of each step:
- any request that emitted an end token is removed and its memory released;
- any newly arrived request that fits is admitted, and its prefill runs;
- the remaining requests continue, with no state to rebuild.
The batch therefore changes shape every step, and its size is bounded by memory and by kernel efficiency rather than by which requests happened to arrive together.
continuous batching -- the batch is reconsidered every step

  time  --------------------------------------------->

  req A  [prefill][dec][dec]
  req B  [prefill][dec][dec][dec][dec][dec][dec][dec][dec][dec][dec]
  req C  [prefill][dec]
  req D          [prefill][dec][dec][dec][dec]
  req E                        [prefill][dec][dec][dec]

         ^     ^     ^     ^     ^     ^     ^     ^
         each arrow is one scheduler decision:
         evict finished, admit waiting, keep the rest
The work done per step is no longer a rectangle of fixed height. It is whatever set of requests is live at that instant, which is what the GPU should be doing.
4. What the scheduler is actually choosing
Three quantities are in tension at every decision, and they cannot all be maximised.
Throughput wants the largest possible batch. The measured decode curve says why: per-request cost falls by 51× between batch 1 and batch 32, because a single sequence leaves the memory system mostly idle. Up to the point where the device saturates, more requests in flight is nearly free.
Latency wants small batches, or at least fair ones. Every request already in the batch competes with every other for the same step, so admitting a large prefill delays everyone mid-decode.
Memory bounds both. A request cannot be admitted without a place to put its cache, and the cache grows with every token it generates. The scheduler is the component that decides when memory pressure forces a request out.
The three are linked by a single number: tokens of KV cache per request. Once the budget is known, the throughput bound and the latency bound become different policies over the same feasible set.
5. Prefill and decode do not want the same thing
The awkward part of the job is that the two phases have opposite profiles, as FlashInfer sets out. Prefill is compute-bound and wants large batches of long sequences. Decode is bandwidth-bound, and a decode step is one token per request regardless of how much work the batch represents.
This produces two scheduling styles, and the choice is visible in a server’s latency distribution:
  (a) prefills jump the queue        (b) prefills wait for a gap
      decode steps pause                 decode keeps its rhythm
      new requests start fast            new requests wait
      tail latency for existing          first-token latency rises
      requests rises                     but is predictable

      |dec|dec|PREFILL|dec|dec|          |dec|dec|dec|dec|dec|
                                              \ PREFILL split /
Neither is wrong. Style (a) minimises time-to-first-token and suits interactive use where a user is watching. Style (b) protects inter-token latency and suits streaming generation already in progress. Most engines expose this as a chunked prefill budget: prefill work is split into slices and fitted into gaps rather than allowed to monopolise a step.
The reason this is a scheduling question rather than a kernel question is that both styles execute identical kernels. The difference is entirely in what the GPU is asked to run next.
6. Where tail latency comes from
A scheduler optimising average throughput will produce a bad p99, and the mechanism is worth stating precisely because it is often mistaken for a kernel problem.
Queueing. Requests arrive faster than they complete, so wait time accumulates. At saturation the queue length grows without bound, and the only remedies are more capacity or admission control.
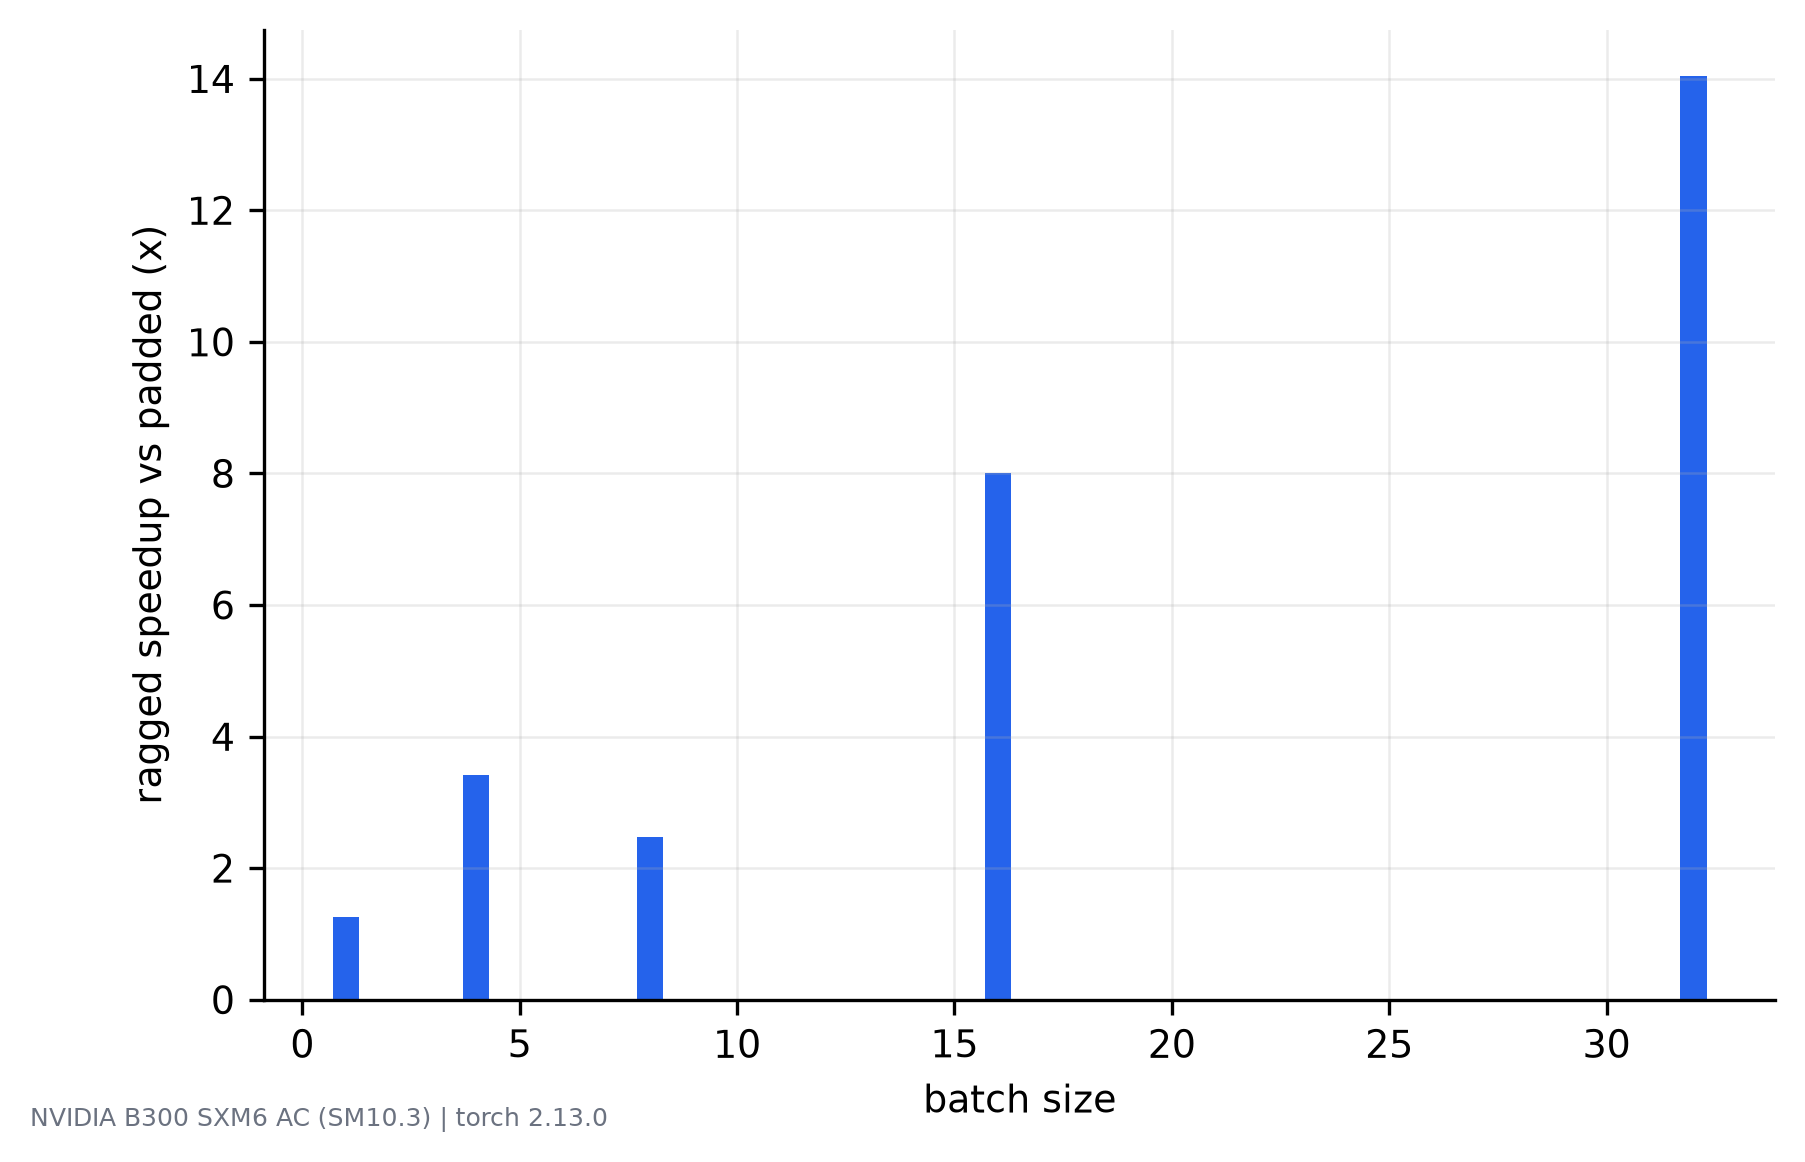
Head-of-line blocking by prefill. One long prompt admitted ahead of many short decodes delays all of them, as style (a) above. The measured cost of ragged work is in FlashInfer, where padding a batch to its longest member wasted 80% of the tokens at batch 32 — the same asymmetry, one layer up.
Memory-pressure eviction. When the KV budget is exhausted, the scheduler must either preempt a request (swap its cache out, or recompute it later) or refuse new ones. Both show up as latency spikes that have nothing to do with any kernel.
Batch-shape flapping. A scheduler that admits in large bursts and then drains completely oscillates between the two ends of the measured decode curve, so its average throughput is well below what its peak batch size suggests.
7. The memory bound is not the throughput bound
A natural assumption is that the cache capacity from PagedAttention also tells you how many requests to run. It does not, and the two numbers differ by more than an order of magnitude.
At a 128K reservation with 128-token requests, the paged allocator admits 3,854 concurrent requests. The measured decode curve shows that bandwidth saturates at a batch of roughly 32 for an 8-head model, and per-request cost stops falling there. Beyond that point, additional requests buy no throughput while consuming memory and queue time.
So the scheduler’s operating point is not the capacity — it is the smaller of the capacity and the batch at which the device saturates. Admitting to capacity would be correct only if the workload were latency-insensitive and memory were free, and neither holds.
This also explains why the memory work and the scheduling work are both necessary rather than redundant. Paging raises the ceiling; scheduling chooses where under the ceiling to operate. A server with excellent paging and naive scheduling runs at its ceiling’s worst point.
8. What this article does not measure
The rest of this series reports measured numbers with run directories behind them. This article does not, and the reason should be stated rather than glossed.
Measuring a scheduler means running a real serving engine under a real arrival process: open-loop request generation at a controlled rate, a length distribution, a latency target, and a metric that separates time-to-first-token from inter-token latency. That is a benchmark of a system, and the harness in this repository measures kernels. None of the figures above are scheduler measurements; they are the constraints the scheduler works against, and each is cited to the article that did measure it.
What a scheduler benchmark would add, and what it would need:
| Question | What to measure | What it would need |
|---|---|---|
| Does continuous batching beat static? | goodput at fixed p99 | open-loop load generator, two engines |
| Which prefill policy wins? | TTFT vs ITL, separately | chunked-prefill support, latency histograms |
| When does eviction start? | evictions/hour vs batch size | KV budget sweep at fixed arrival rate |
| Where is the throughput ceiling? | goodput vs offered rate | saturation sweep, queue-length trace |
Until that exists, the honest claim is the one this article makes: the scheduler is where the measured kernel and memory results are turned into throughput, and the constraints on it are now quantified even though the policies are not.
9. Summary
- Static batching holds a batch open until its longest request finishes, wasting both compute and memory for every request that ended early.
- Continuous batching reconsiders the batch every decode step: finished requests leave, new ones are admitted, survivors carry on with no rebuild.
- Three quantities are in tension at each decision — throughput, latency, memory — and they are linked by bytes of KV cache per request.
- Prefill and decode have opposite profiles, so the scheduler must choose between fast first tokens and steady inter-token latency. Chunked prefill is the usual compromise.
- Tail latency comes from queueing, head-of-line blocking by prefill, memory-pressure eviction, and batch-shape flapping — none of which is a kernel problem.
- The memory bound is not the throughput bound. Capacity admits thousands of requests; bandwidth saturates at tens. The scheduler’s operating point is the smaller number.
References
- Woosuk Kwon, Zhuohan Li, Siyuan Zhuang, Ying Sheng, Lianmin Zheng, Cody Hao Yu, Joseph E. Gonzalez, Hao Zhang, and Ion Stoica. Efficient Memory Management for Large Language Model Serving with PagedAttention. SOSP, 2023.
- Cade Daniel, Chen Shen, Eric Liang, and Richard Liaw. How Continuous Batching Enables Massive Throughput for LLM Inference. Anyscale, 2023.
- Lianmin Zheng, Liangsheng Yin, Zhiqiang Xie, Chuyue Sun, Jeff Huang, Cody Hao Yu, Shiyi Cao, Christos Kozyrakis, Ion Stoica, Joseph E. Gonzalez, Clark Barrett, and Ying Sheng. SGLang: Efficient Execution of Structured Language Model Programs. NeurIPS, 2024.
- Amey Agrawal, Ashish Panwar, Jayashree Mohan, Nipun Kwatra, Bhargav S. Gulavani, and Ramachandran Ramjee. SARATHI: Efficient LLM Inference by Piggybacking Decodes with Chunked Prefills. 2023.